Blog · Energy & grids
Power plants in Italy map: 4 plants in a 34,936-site layer
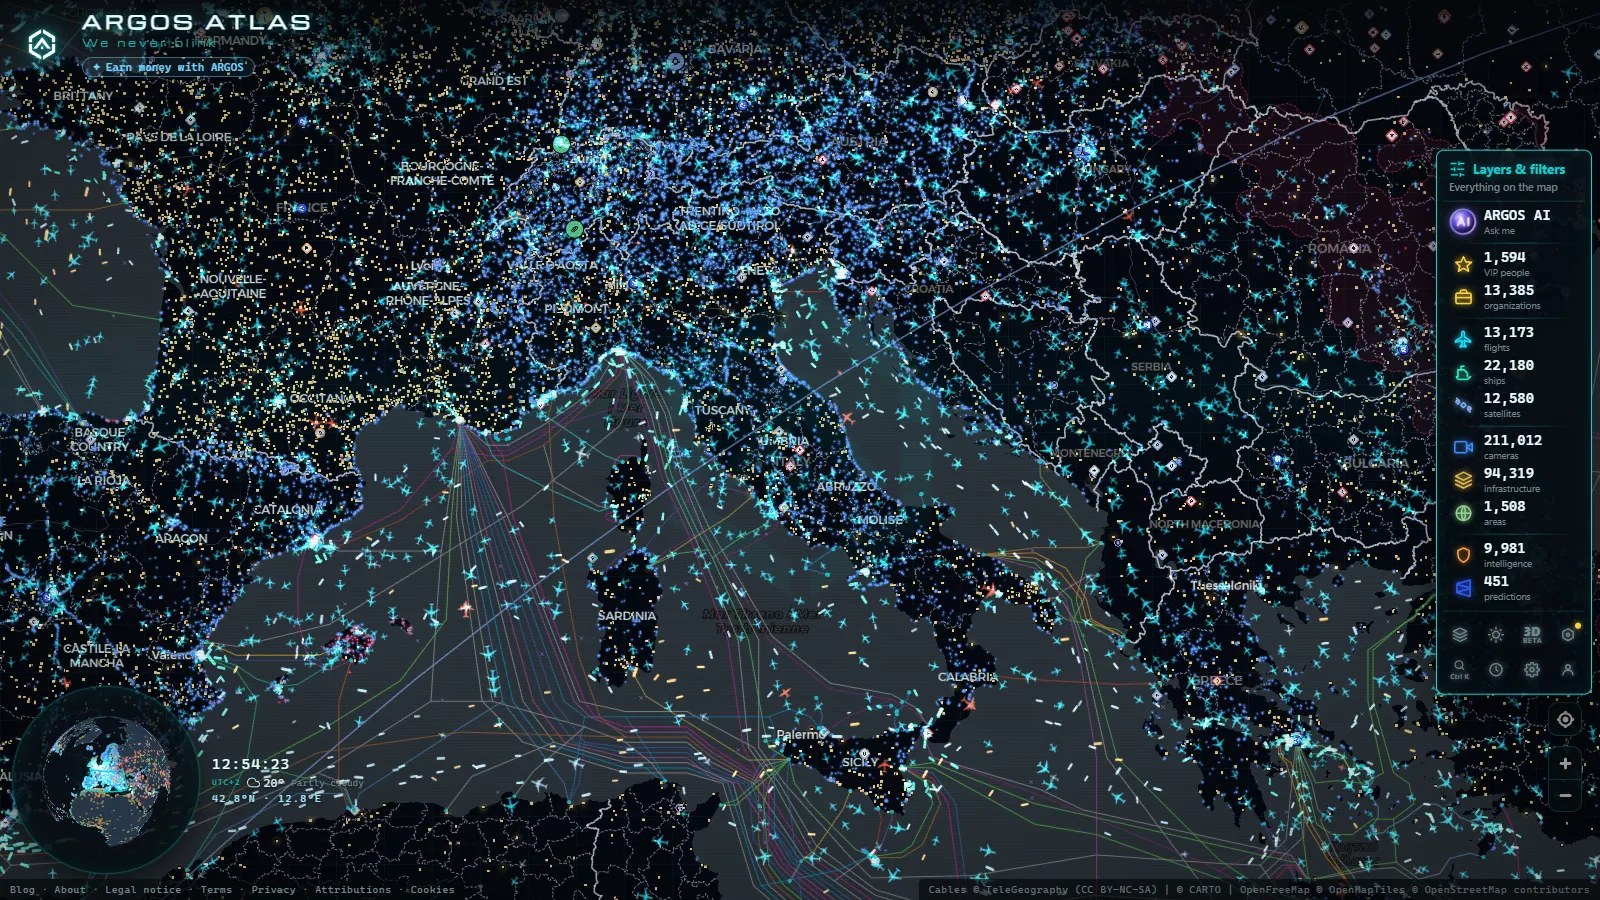
Italy runs mostly on gas, and most of that gas burns in a short list of thermal plants you can put a finger on. Four of them explain the national picture better than any pie chart: Tor di Valle on the Tiber in Rome, Lamarmora in the middle of Brescia, Turbigo beside the Ticino west of Milan, and Moncalieri on the Po just south of Turin. Three of the four sell heat as well as electricity, which is why they sit inside cities instead of out in open country.
This piece closes a country series that already covers the same ground for the power plants of China, the Russian grid and generation in the United States. Same method every time: what the layer holds, what each site actually is, and the part most guides skip, what you cannot verify from outside.
What the power plants in Italy map actually shows
The power layer on the live ARGOS ATLAS map holds 34,936 generation sites worldwide (count as of September 2026), and northern Italy is one of its denser corners. Each point carries a position, a name, a technology tag when the source dataset has one, and an operator when that is recorded.
That is a catalogue, not telemetry. Opening a plant card tells you what stands on that ground, who runs it and what it burns. It does not tell you whether the turbine is spinning tonight, how many megawatts it is pushing into the grid, or whether a unit was mothballed two winters ago and never restarted. Per plant, per minute output is not published as an open feed in Italy, so nobody can honestly map it, us included.
What the layer is genuinely good for is geography. Zoom out and the shape of Italian electricity is obvious: thermal generation strung along the Po valley next to the industry and the cities that consume it, hydro packed into the Alpine valleys, solar and wind concentrated in the south and the islands, and long transmission corridors doing the work of moving power from where it is made to where it is used.
Tor di Valle: the Rome plant that sells hot water
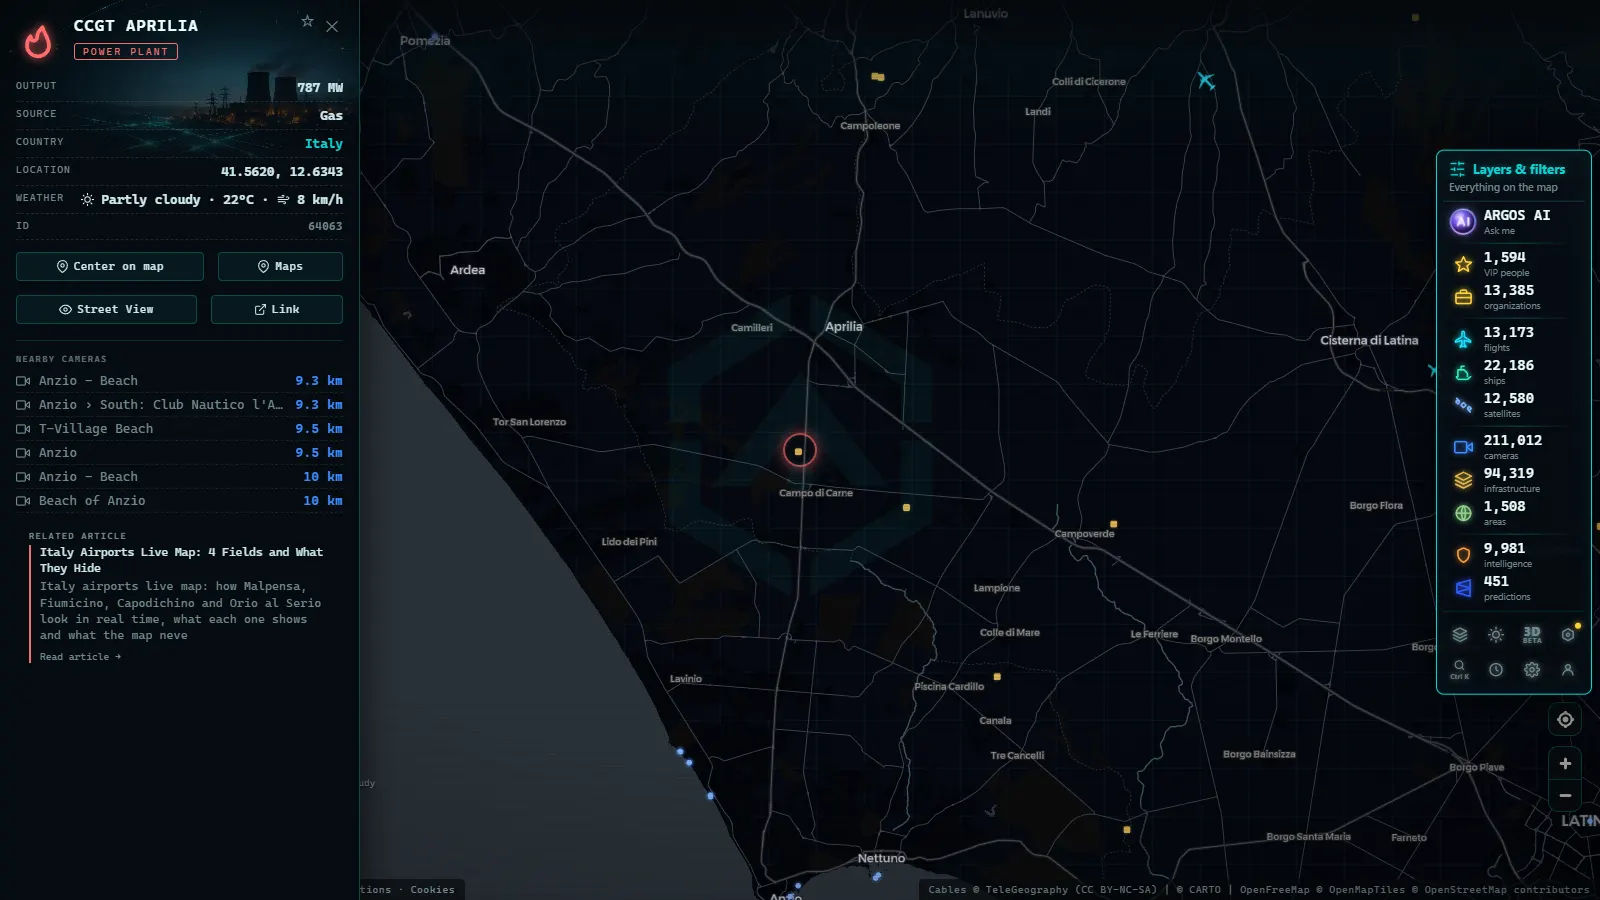
Tor di Valle sits on the right bank of the Tiber in south-western Rome, next to the abandoned racecourse that made the name famous for entirely different reasons. It is a gas-fired cogeneration plant run by Acea, the city's utility, and its second product matters as much as the first: hot water piped into the district heating network that serves the Torrino and Mostacciano neighbourhoods.
Cogeneration is the reason it is where it is. A plant that only makes electricity can be built anywhere near a transmission line. A plant that also sells heat has to be close enough to its customers for the pipes to make sense, which pushes it inside the urban fabric. Look at the surroundings on satellite imagery and the logic reads clearly: residential blocks on one side, the river on the other, the ring road within sight.
From outside you can confirm the footprint, the stacks, the gas connection and the operator. You cannot confirm the running schedule, and in a cogeneration plant that schedule is driven partly by heat demand, so it is seasonal in a way pure power stations are not.
Lamarmora, Brescia: a whole city plumbed into one site
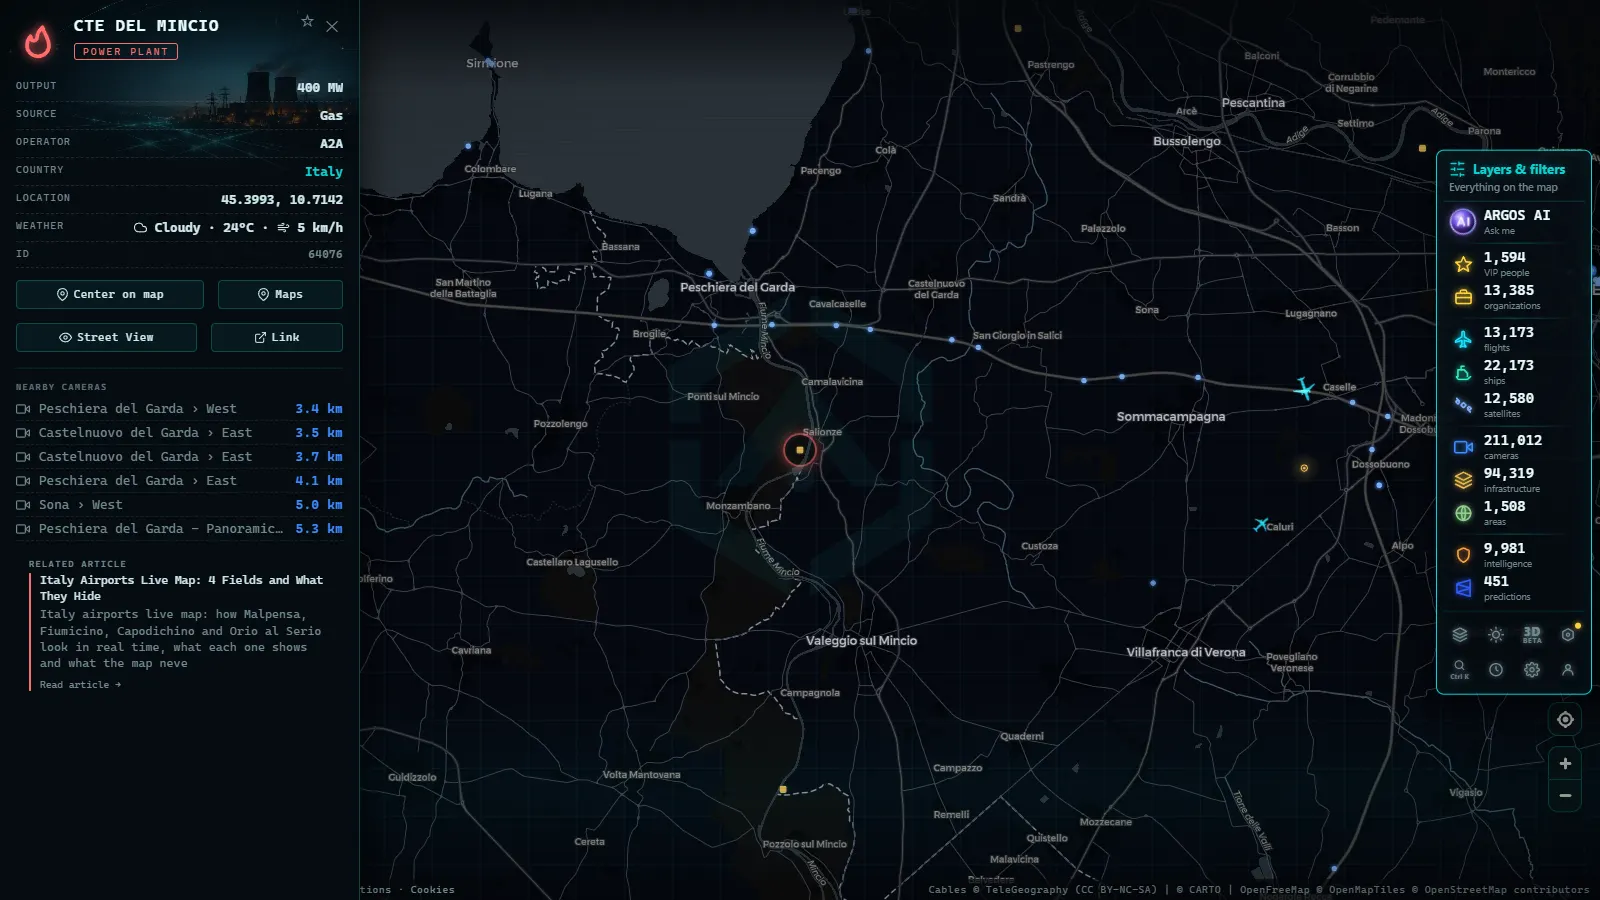
Brescia is the clearest example in Italy of a city that treats a power plant as municipal infrastructure. The Lamarmora site, operated by A2A, burns gas and waste-derived fuel and feeds one of the country's older and denser district heating networks, alongside the neighbouring waste-to-energy plant. Between them they heat a large share of the built-up area.
This is why the plant is inside the city rather than banished to an industrial zone. It also explains a detail that confuses people reading the map: two distinct facilities sit almost on top of each other, and depending on the source dataset they may appear as one point or two, with different technology tags. When you see two energy points a few hundred metres apart in Brescia, that is not a duplicate, it is a cogeneration plant and a waste-to-energy plant sharing a heat network.
Turbigo and Moncalieri: the northern industrial corridor
Turbigo sits on the Ticino in the province of Milan, beside the Naviglio Grande canal. It is a veteran thermal station, originally built for the oil era and later rebuilt around combined-cycle gas units. The water is the point: canal and river cooling is what put heavy thermal generation on that stretch of Lombardy in the first place, long before anyone drew a gas map of Europe.
Moncalieri is the Turin equivalent, a combined-cycle plant on the Po immediately south of the city, run by Iren, tied into the district heating network that warms a large part of Turin. Same pattern as Rome and Brescia: gas in, electricity to the grid, hot water to the pipes, sited close enough to the customers to make the second product viable.
Together the four trace the axis where Italian demand actually lives. Three of the four are in the north, and the northern three sit within the Po basin, which is also where the country's industry, its rail freight and its worst winter air quality problems are.
The four plants side by side
| Plant | Where | What it is | Operator | What you can check from outside |
|---|---|---|---|---|
| Tor di Valle | Rome, on the Tiber | Gas cogeneration, power plus district heating | Acea | Location, stacks, urban heat network it serves |
| Lamarmora | Brescia, inside the city | Cogeneration on gas and waste-derived fuel | A2A | Location, adjacency to the waste-to-energy plant |
| Turbigo | Ticino river, Milan province | Thermal site rebuilt around combined-cycle gas | Iren | Location, canal cooling, industrial footprint |
| Moncalieri | Po river, south of Turin | Combined cycle plus district heating for Turin | Iren | Location, heat network, river siting |
Everything in that table is structural: it describes what is built there. None of it is a live reading, and that distinction is the whole honest core of mapping energy infrastructure from open sources.
What the power plants in Italy map will not tell you
The useful list is the negative one.
- No output, ever. No megawatts, no load factor, no fuel burn. Not hidden behind a paywall, simply not published openly per plant.
- No operating status. A retired unit and a running one look identical on the map until the source dataset is corrected.
- Coordinate drift. Open infrastructure datasets sometimes place a point on the substation, the office gate or the centroid of a large site rather than on the turbine hall. Treat a marker as within a few hundred metres, not surveyed.
- Missing technology tags. Some Italian entries arrive without a fuel or technology field, so they render as generic energy points.
- Update cadence. The energy layer is a catalogue rebuilt on a scheduled ingest, not a stream. Aircraft and vessels are the live layers on this map; power is not one of them.
- No cameras on plants. The camera network holds 173,667 sources worldwide (count as of September 2026) and not one of them is pointed at these four sites. Italian traffic camera coverage is motorways, tunnels and Alpine passes, by design.
Water, steam and the plants that are not there
The four gas plants above are the headline, but they are not the whole Italian map. The Alpine arc, from Piedmont across Lombardy to Alto Adige, is packed with hydro, including pumped storage reservoirs that act as batteries for the northern grid. Tuscany holds something no other European country has at that scale: the geothermal steam field around Larderello, the oldest working geothermal generation anywhere. Puglia, Sicily and Sardinia carry most of the wind, and solar leans heavily southward for the obvious reason.
Two absences are as informative as any presence. Coal has been shrinking for years, so plants that dominated regional generation in the 2000s now appear as sites in wind-down. And there is no operating nuclear generation at all: the old stations are decommissioning projects, not power plants, even when a dataset still lists them under a generation category. If you want the underlying vocabulary before reading any of this, the guide to power plant types covers what separates a combined cycle from a cogeneration unit.
What readers actually open on the Italian map
We measure which cards get opened, and the Italian pattern is consistent: named local infrastructure beats anything abstract.
| Card | Type | Opens in the last 90 days |
|---|---|---|
| Malpensa | Airport | 104 |
| Tor di Valle | Power plant | 99 |
| Lamarmora | Power plant | 98 |
| Fiumicino | Airport | 96 |
| Il Caravaggio (Bergamo) | Airport | 95 |
Two of the five most opened Italian cards are power plants that most people outside their own province have never heard of. That is the argument for naming things. A map that says "several plants in Lombardy" gets ignored; a map that says Turbigo gets clicked.
How to read it yourself in two minutes
Open the map, go to the infrastructure family in the side rail and filter to energy. Zoom to the Po valley first, because that is where the density is, then work outward to the Alps for hydro and south for renewables. Search a plant by name if you already know it: Turbigo, Moncalieri and Lamarmora all resolve directly.
When a card opens, read it as an identity document, not a dashboard. Name, operator, technology, position. If you want to know whether that plant ran last night, the map is the wrong instrument, and any tool that claims otherwise for Italy is guessing.
Frequently asked questions
Is the power plants in Italy map free, live and open without registration?
Yes. The map is free, needs no account and no card. One nuance worth keeping straight: the power layer is a catalogue that gets rebuilt on a scheduled ingest, so it is current rather than second by second. The genuinely live layers are aircraft and vessels, which move while you watch.
How many power plants can I see on the map?
The power layer holds 34,936 generation sites worldwide (count as of September 2026). We do not publish a separate certified figure for Italy alone, so we will not quote one here. Zoom into the Po valley and count what loads in view if you need a number for a specific area.
Can I see how much electricity Tor di Valle or Moncalieri is generating right now?
No, and neither can anyone else from an open feed. Real-time output per plant is not published in Italy in a form that can be mapped. What you get is identity and location: name, operator, fuel or technology tag where the source has one. Anything claiming live megawatts per Italian plant is modelling, not measuring.
Does Italy still have nuclear power plants?
Not in operation. Italy shut its programme down by referendum in the late 1980s and the old sites, including Caorso and Trino, are in long-term decommissioning under the state company Sogin. They appear as industrial sites, not as generating units. Montalto di Castro was rebuilt as a gas plant instead.
Are there webcams pointing at Italian power stations?
No. Italian public camera coverage is built for roads: motorway gantries, tunnel portals, Alpine passes and city traffic junctions. None of it is aimed at a turbine hall or a cooling stack. If a plant appears in a camera frame it is by accident, in the background of a road view.
- Power Plants in Turkey Map: Dams, Coal, Gas and Nuclear Sites
- Poland Power Plants Live Map: 4 EC Plants That Heat Cities
- World map of dams and reservoirs: 5,356 points you can open
- South America Power Plants: Country by Country on the Map
- Norway power plants on the map: hydro, dams and live views
- Why Blackouts Happen and How Power Grids Are Monitored 24/7