Blog · Maps & technology
How Online Maps Work: Tiles, Layers, and Real-Time Data Explained
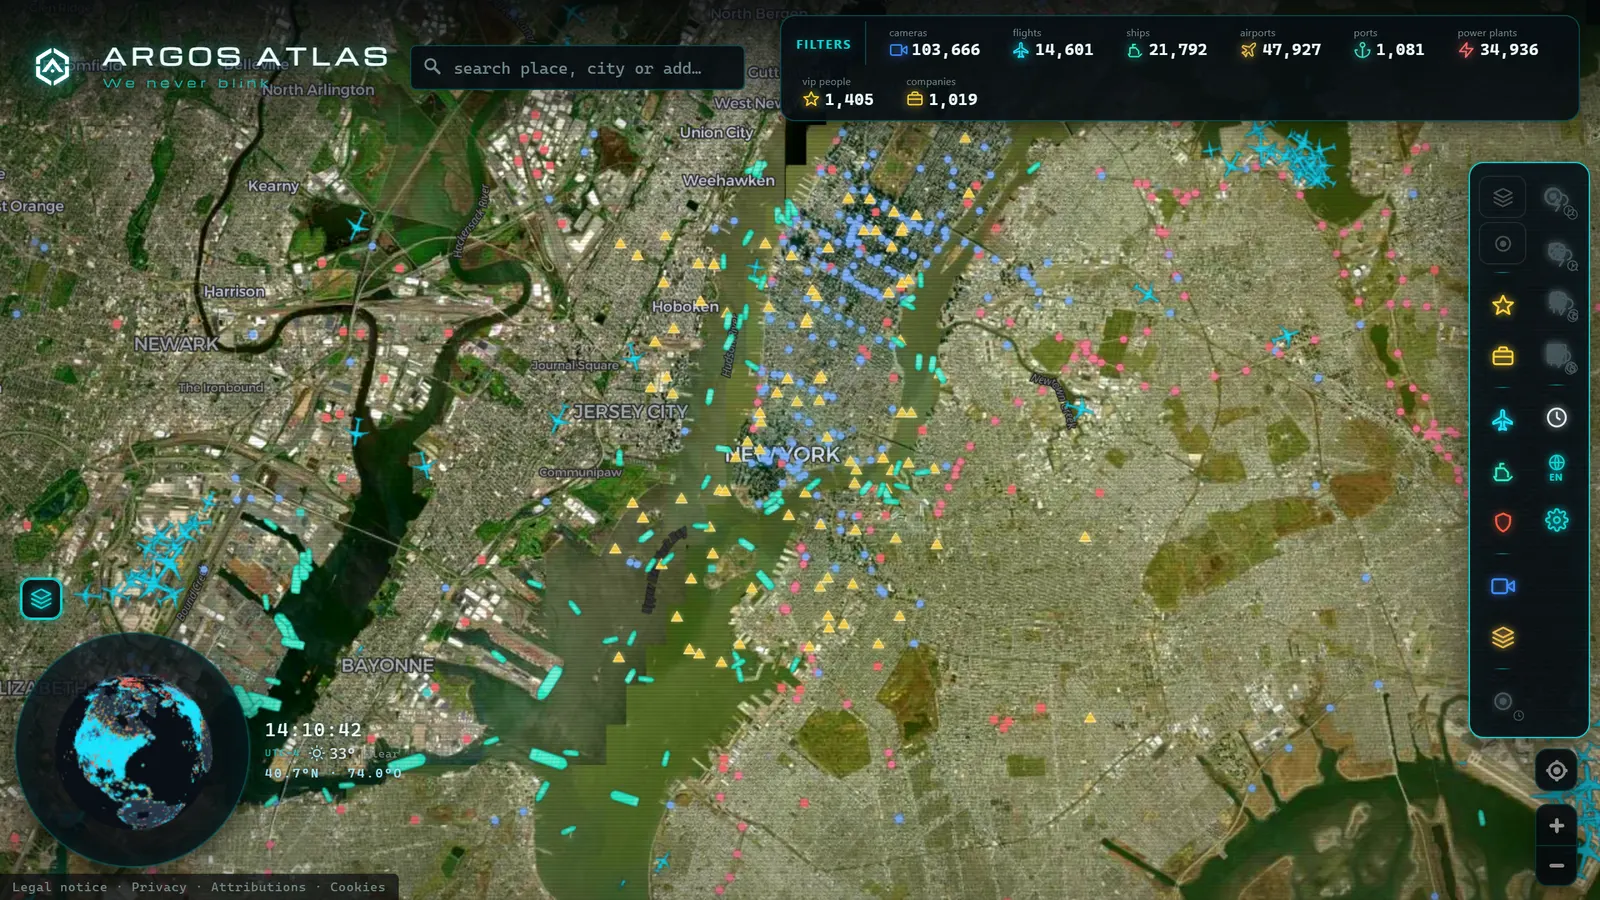
You open a map on your phone, drag your finger, pinch to zoom, and the entire world responds instantly. It feels like magic, but understanding how online maps work is simpler than it looks: behind it is a brilliant engineering idea (slicing the planet into small squares) plus a projection with a known trade-off, a layer system, and a constant flow of data to your screen. This article takes the web map apart piece by piece, in plain language with no unnecessary jargon. By the end, you will look at any interactive map (your route app, a weather viewer, or something like Argos Atlas) knowing exactly what is happening under the hood.
The Key Idea: Slicing the World Into Tiles
The original problem was enormous: how do you serve a map of the entire planet, with street-level detail, to millions of people simultaneously? Sending every user one giant image is impossible. The solution the industry adopted was to slice the world into tiles: pre-rendered map squares organized by zoom level.
It works like a pyramid. At zoom level 0, the entire world fits in a single tile. At level 1, that square splits into four. At level 2, into sixteen. Each level quadruples the number of tiles and doubles the detail. At high zoom levels (where you can see doorways and crosswalks) the planet is divided into billions of small squares, each with a unique address: zoom level, column, and row.
When you pan the map, your browser does a quick calculation: "I am looking at this area at this zoom, so I need these specific tiles." It requests them from the server, receives them, and assembles them like puzzle pieces. That is why maps load in little squares: you are literally watching tiles arrive one by one. And that is why the map is so fast: the server is not calculating anything on the fly, it is delivering pre-built pieces that your browser also caches, so it does not have to re-fetch them.
Raster vs Vector Tiles: Rendered Image or Raw Data
Not all tiles are the same. There are two families, and the difference explains many things you have probably noticed when using maps.
Raster Tiles: The Photo of the Map
Classic tiles are raster: images already rendered, typically 256 pixels on each side. The server drew the map once (with its colors, typefaces, and icons) and sends you the result as a ready-made image. The advantage: any device can display them, no matter how old. The drawback: they are rigid. At intermediate zoom levels they look blurry, and if you want the map in a different language or visual style, you need a completely different set of images.
Vector Tiles: The Data Your Browser Renders
Modern maps use vector tiles: instead of an image, the server sends raw data (this line is a road, this polygon is a park, this point is a station) and your browser renders and styles them on the fly.
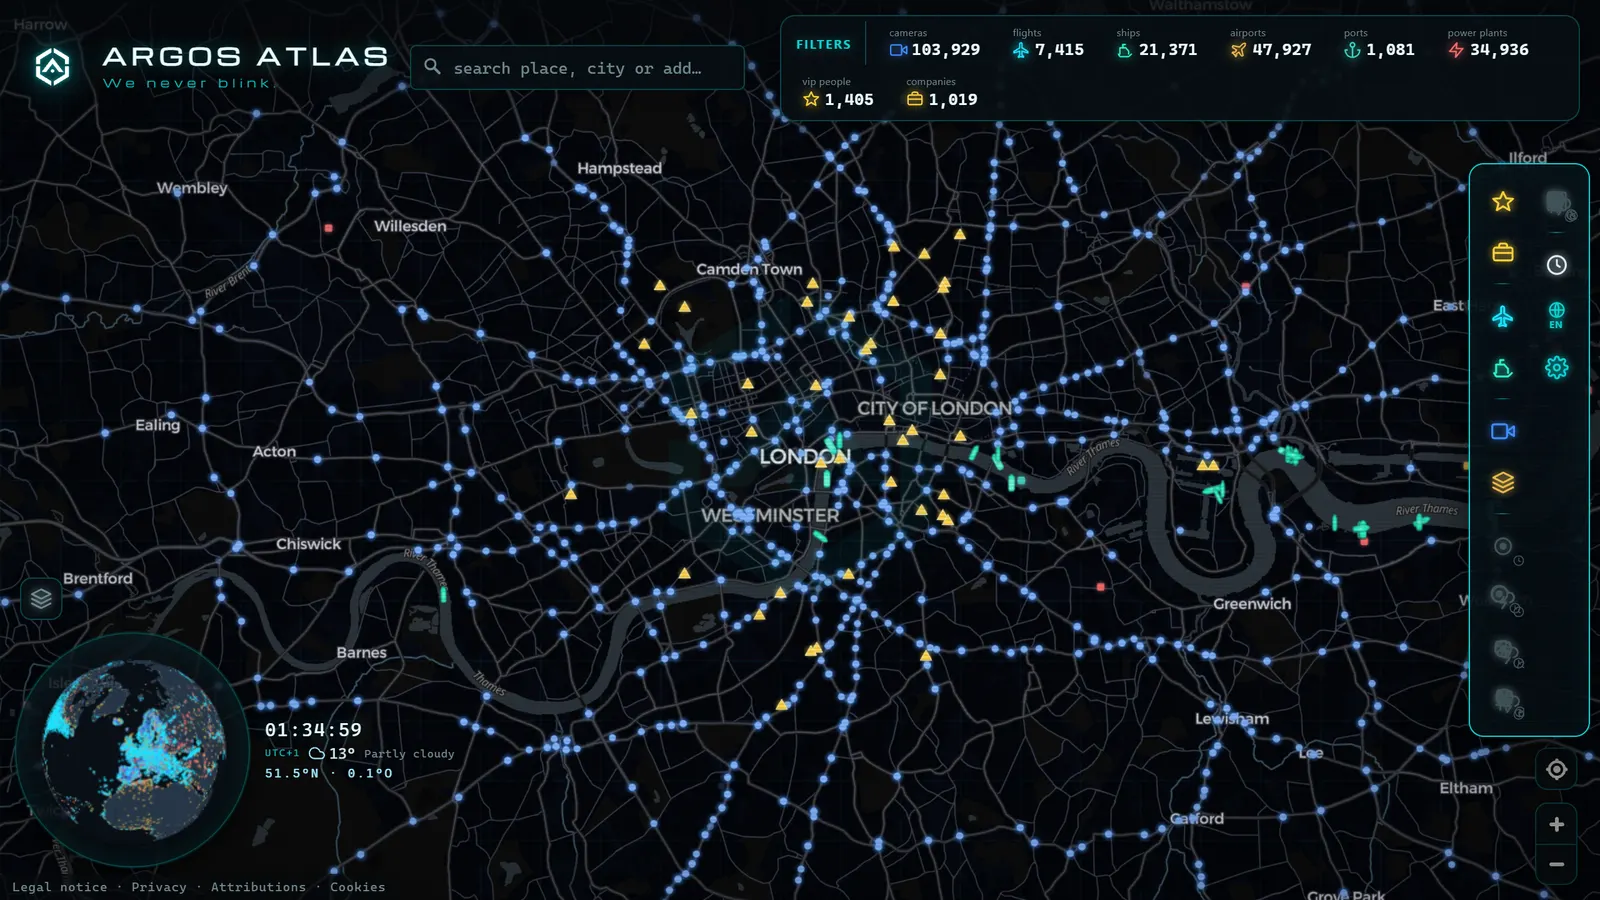
This changes everything. Because the drawing happens on your device, the map can switch language or visual theme without downloading anything new: the dark mode on many maps is not a different set of images, it is the same data painted with a different palette. Text stays sharp at any zoom level, labels can rotate with the map, and the transition between zoom levels is smooth rather than jumping between images.
Web Mercator: The Projection with a Known Trade-Off
The Earth is roughly a sphere and your screen is flat, so something must be sacrificed. Web maps use almost universally the Web Mercator projection, inherited from the classical Mercator used by 16th-century navigators. It is the de facto standard of web map technology.
Its great strength: it preserves angles. Streets intersect on the map at the same angle as in reality, north is always up, and local shapes remain undistorted. For a map where you zoom to your street corner, that is exactly what you want.
Its known trade-off: it distorts areas significantly, the further you move from the equator. The canonical example is Greenland: on any web map it appears continent-sized, as if it rivals Africa, when in reality Africa is vastly larger. The distortion is mathematical, well understood, and accepted; it is not a map error, it is the price of the projection.
There is an interesting consequence: the shortest paths between two distant points on Earth (the great circle routes that aircraft follow) appear as curves on a Mercator map, even though they are straight lines on a globe. If you have ever wondered why a flight from New York to Tokyo seems to arc up over Alaska rather than going straight west, this is why.
Recorded straight off the map, no sound.
Layers: The Base Map and Everything Stacked on Top
So far, the base map: the background of streets, rivers, and borders, typically built from data provided by projects like OpenStreetMap. But a modern interactive map is a sandwich of layers stacked on that base.
Each layer is a self-contained dataset drawn on top of the base map using three geometry types:
- Points: traffic cameras, aircraft in flight, ships, airports, power plants.
- Lines: routes, trajectories, highlighted roads.
- Polygons: zones, coverage areas, administrative boundaries.
The crucial point is that each layer has its own source and its own update cadence. In a viewer that combines several (for example, public traffic cameras alongside live flights and ships) the aircraft layer may refresh every few seconds while a camera image updates at the frequency the responsible agency publishes. The map displays them together, but each dataset lives at its own tempo. Understanding this prevents many common misreadings of what you are seeing.
Real-Time Data on the Map: How Movement Gets There
How do the points move? There are two generic mechanisms that virtually all services use:
- Periodic polling: your browser asks the server every few seconds "are there new positions?" and updates what has changed.
- Open connection: the browser maintains a persistent channel with the server, which pushes new data as soon as it has it, without waiting for a request.
In both cases, what you see on screen is not "the present" in a strict sense, it is the most recent data that has completed the journey from sensor to your screen. That nuance (what "live" actually means, how much latency exists, and why two websites might show the same aircraft in different positions) warrants its own article: we cover it in what "live" means on a map.
Styles and Modes: The Same World, Multiple Skins
Because vector tiles separate data from rendering, a single map can offer multiple "skins." The two most common:
- Dark mode: the same cartography with a night palette, easier on the eyes in low light and making data points stand out more.
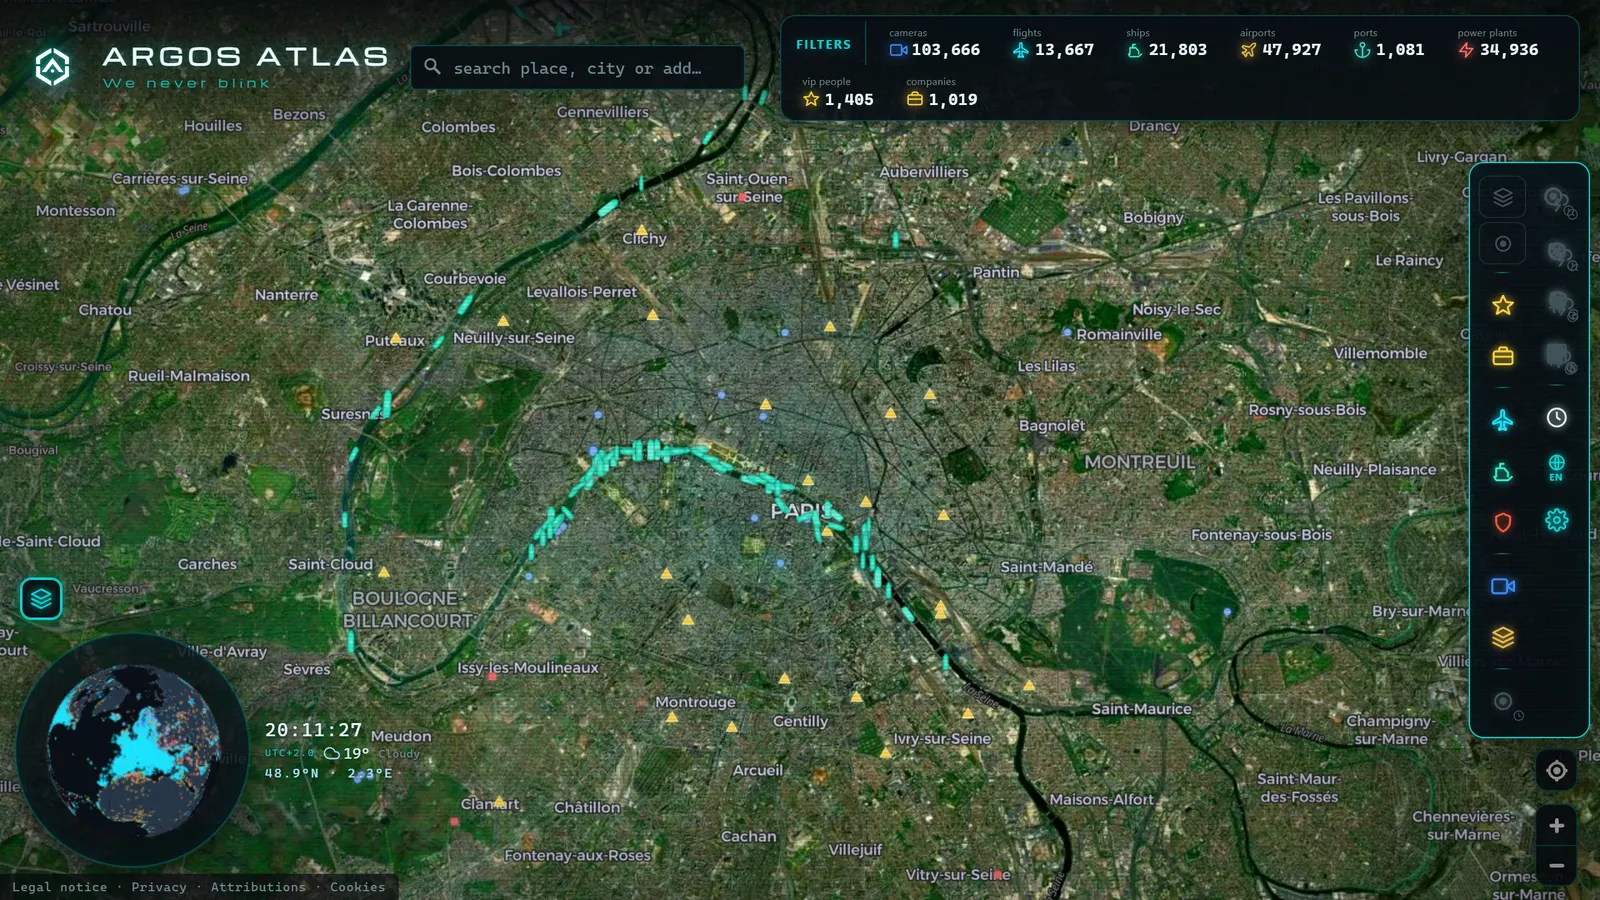
- Satellite mode: replaces the cartographic drawing with aerial and satellite imagery, useful for recognizing the real terrain. Note: those images are not live, they are composite mosaics. In free satellite imagery we explain what to expect from them.
Argos Atlas, for example, offers both modes (dark and satellite) over its map of cameras, flights, ships, and infrastructure, along with global search to jump to any point on the planet.
Rendering on Your Device: Thousands of Points Without Slowing Down
One piece remains: how can your phone draw thousands of moving points simultaneously without struggling? The answer is that modern maps do not render using the normal techniques of a web page, they exploit the browser's graphics acceleration: the same hardware that powers video games handles the map drawing.
This allows the entire scene to be redrawn many times per second: rotating the map, tilting it, animating thousands of aircraft and ships gliding smoothly between updates. When a map performs well with a huge amount of data on top, it is not coincidence, it is the graphics chip in your own device doing the heavy lifting, with the browser as the intermediary.
Why Understanding This Makes You a Better Map User
This might seem like general knowledge with no practical payoff, but understanding how a web map works changes how you use it:
- If the map loads in patches, you know it is normal: tiles arriving, not a bug.
- If you compare country sizes by eye, you know Mercator is misleading you and you look up the real area.
- If you see data labelled "live," you know to ask about the source and cadence of each layer before drawing conclusions.
- If satellite mode shows your street with construction work that finished long ago, you know you are looking at a composite of mixed dates, not a camera.
In short: you stop treating the map as an oracle and start treating it as what it is, a tool with known rules. And tools are far more useful when you understand their rules.
Frequently Asked Questions
Why do maps load in little squares?
Because the world is sliced into tiles: pre-rendered map squares organized in a pyramid where each zoom level quadruples the detail. Your browser calculates which tiles it needs for the area you are viewing, requests them from the server, and places them as they arrive. Those little squares you watch fill in are, literally, tiles landing on your screen.
What is a layer on a map?
A dataset with its own source that is drawn on top of the base map: points (cameras, aircraft, ships), lines (routes, roads), or polygons (zones, administrative areas). Each layer updates at its own frequency and can typically be enabled or disabled independently. A modern map viewer is essentially a base map plus an ordered stack of layers.
Why does Greenland look so large?
Because of the Web Mercator projection, the standard for web maps. This projection preserves angles (essential so that streets do not distort when you zoom in) but in exchange it stretches areas the further they are from the equator. Greenland, far to the north, is enormously inflated: it appears to rival Africa when it is in reality far smaller. This is a known and accepted distortion, not a map error.
How does a map update in real time?
In one of two generic ways: either the browser asks the server every few seconds if there are new data, or it keeps an open connection through which the server pushes updates as soon as it has them. In both cases, each layer has its own cadence: aircraft positions may refresh in seconds while a traffic camera updates at the frequency its official source publishes.
Conclusion
An online map is a pyramid of tiles, a projection that sacrifices area accuracy to preserve angles, a stack of layers with their own sources, and a data flow that your browser renders with help from the graphics chip. No magic, elegant engineering you carry in your pocket. The best way to internalize all of this is to see it in action: open the map, switch layers on and off, toggle between dark and satellite mode, zoom to your street, and watch the tiles arrive. You now know exactly what you are looking at.
Frequently asked questions
Why do maps load in little squares?
Because the world is sliced into tiles: pre-rendered squares for each zoom level. Your browser only downloads the tiles covering the area you are looking at, and paints them as they arrive. That is why you sometimes watch the map fill in piece by piece.
What is a layer on a map?
A dataset drawn on top of the base map: points (cameras, aircraft), lines (routes, roads), or polygons (zones, regions). Each layer has its own source and its own update frequency, and can be turned on or off independently.
Why does Greenland look so large?
Because of the Web Mercator projection, the standard for web maps. It preserves angles (useful for navigation and for keeping local shapes undistorted) but stretches areas near the poles. Greenland looks continent-sized when it is actually far smaller than Africa.
How does a map update in real time?
The browser either polls the server every few seconds asking for new positions, or keeps an open connection through which the server pushes updates as they arrive. Each layer has its own rhythm: aircraft positions refresh in seconds; a traffic camera image refreshes at whatever cadence the operator publishes.