Blog · Energy & grids
Norway power plants on the map: hydro, dams and live views
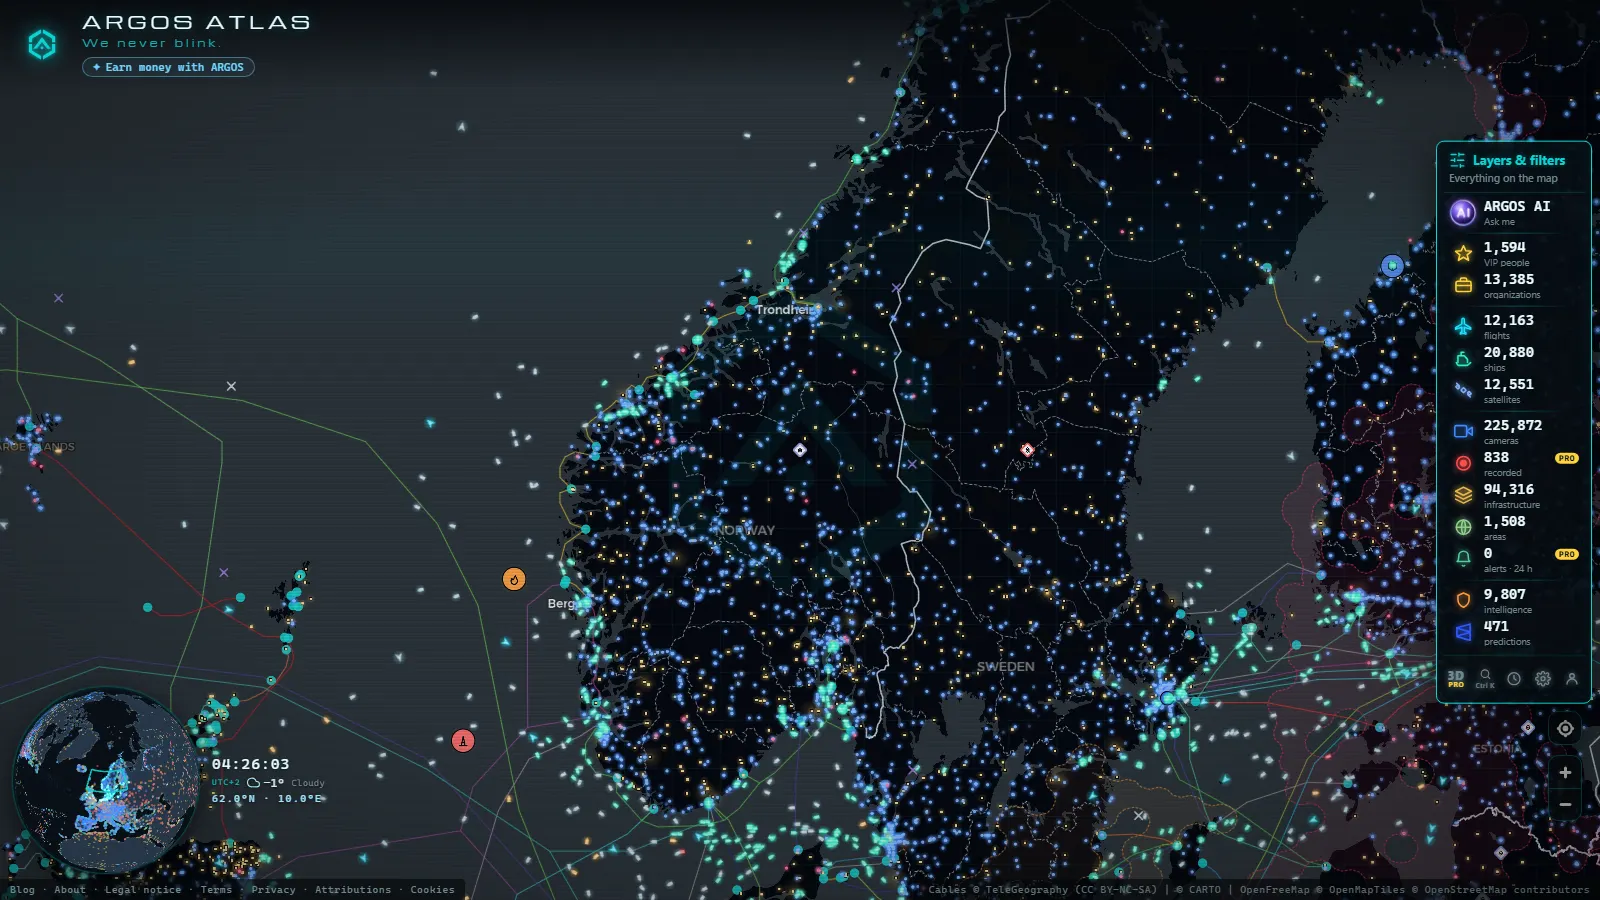
Norway's power plants sit on the map as individual located points (name, fuel, installed capacity) inside a worldwide energy layer of 34,936 power installations. It is free, there is no account and nothing to install, and almost every Norwegian point you open says the same thing in the fuel field: hydro. Water falling from mountain reservoirs to the fjords is what lights Oslo and feeds the aluminium works on the west coast.
What you get is a tour of where the plants are, not a control room. The map carries position, fuel and nameplate capacity, plus the 5,356 dams of the dam layer and whatever a nearby public road camera shows of a reservoir, a pass or a valley floor. There is no live output and no water level. Open the live energy map, zoom between Bergen and Trondheim, and the density tells the story on its own.
The essentials, in 20 seconds
- Hydro dominates: nearly all of Norway's generating capacity is falling water, from high reservoirs down to run-of-river plants.
- 34,936 power installations worldwide in the energy layer, Norwegian plants among them, each with a fuel field and a capacity figure.
- Nedre Vinstra (343 MW) and Aura (352 MW): two mountain hydro plants you can open as a card right now.
- 5,356 dams in the dam layer, because in Norway the reservoir is the fuel tank and dam plus plant is one scheme.
- Free, no sign-up, and with 225,872 cameras in the camera layer (count as of October 2026) some of them look at Norwegian valleys.
★ Malvik
Why Norway power plants are almost all hydro
Geography decided it. Norge fits just over 5.6 million people into 386,224 km² of mountain, plateau and fjord, with heavy rain and snow on the western slopes and often a thousand metres of fall between a plateau lake and the sea. Store the water high, drop it down a tunnel, and you have firm power with no fuel bill. That is why the fuel field reads hydro again and again, and why the thermal fleet is marginal: a few waste-to-energy and gas units near cities and heavy industry, never the backbone.
The second consequence is storage. A reservoir in Innlandet or Vestland holds months of energy, so Norwegian hydro works as a battery for northern Europe: fill on the summer melt, draw down through the winter dark. The map will not give you the water level, but it does give you the pair, dam and plant, usually a few kilometres apart with a tunnel between them that nobody can see. How power plants generate electricity covers the mechanics.
Where Norway power plants cluster: empty north, industrial south
Split the country in two and the energy map splits with it. The south and west, from Telemark through Vestland and up Gudbrandsdalen, holds the dense clusters: short steep rivers, old concessions, and industry built next to the power instead of the other way round. Aluminium and ferroalloy works went where the megawatts were, which is why some of the largest plants sit in municipalities of a few thousand people.
North of Trøndelag the pattern thins. Nordland, Troms and Finnmark have large rivers and large plants with hundreds of kilometres between them, and demand concentrated in a handful of towns and industrial sites. On the coast the load is the harbour: zoom on Trondheim or the inlet at Namsos and you are looking at where cables and quays meet.
Norway · GDP (nominal)
Norway · GDP per capita
A coal country reads nothing like this. Poland's power plants cluster around mines and city heating networks, which is the opposite logic.
Two Norwegian hydro plants you can open right now
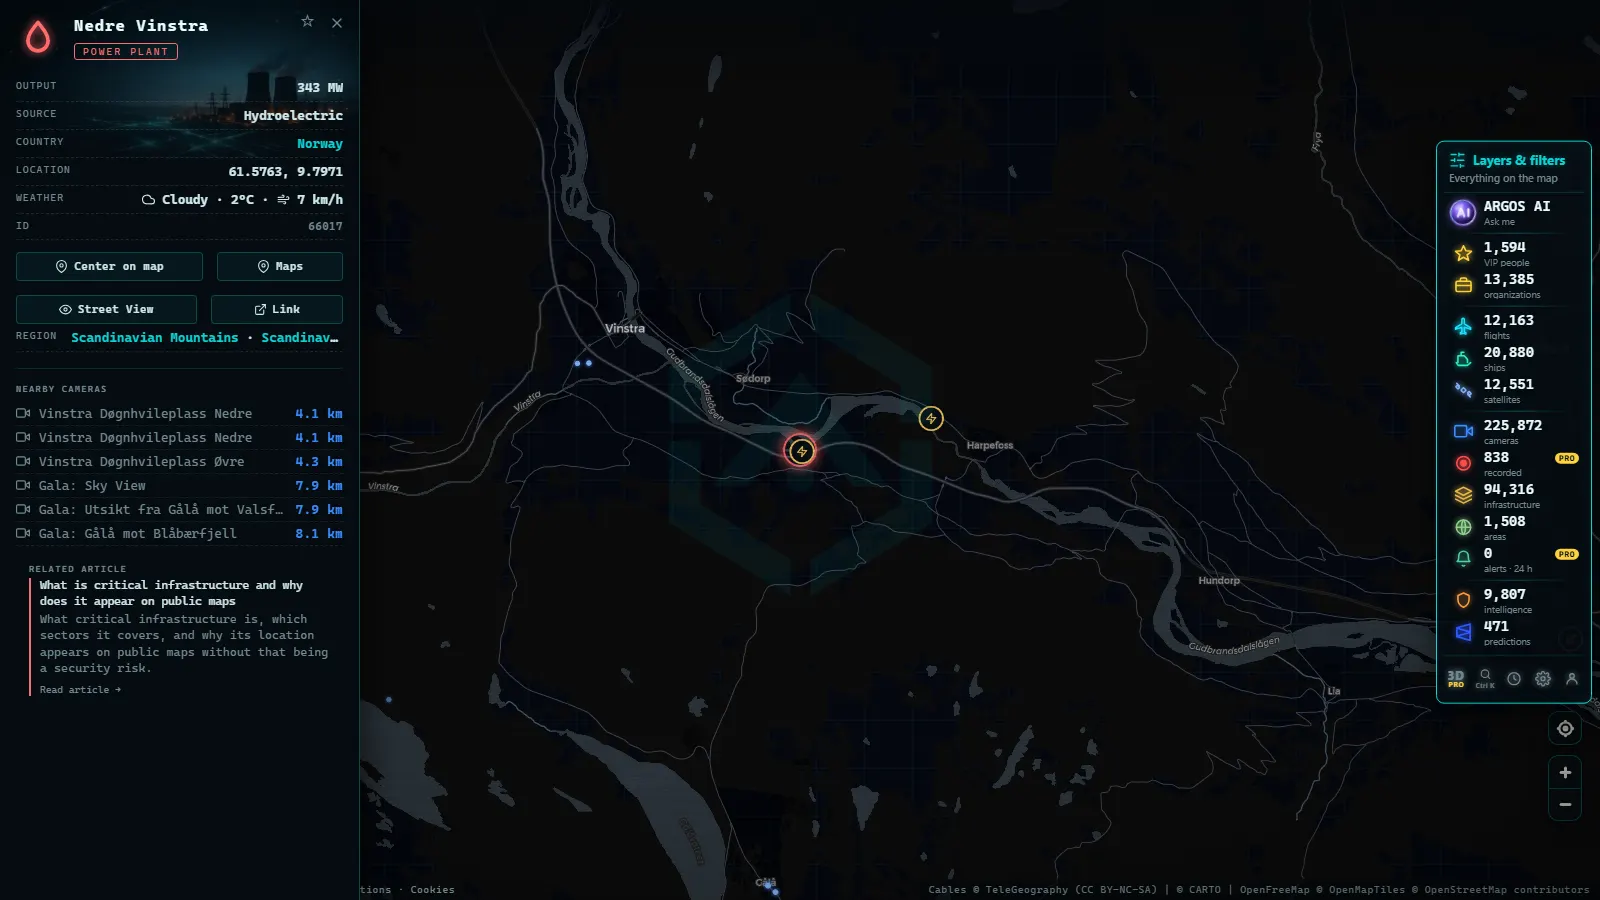
Two cards say more than a list. Nedre Vinstra sits in the Gudbrandsdalen system in Innlandet, fed from the lakes of the Vinstra watercourse, and the map gives it 343 MW.
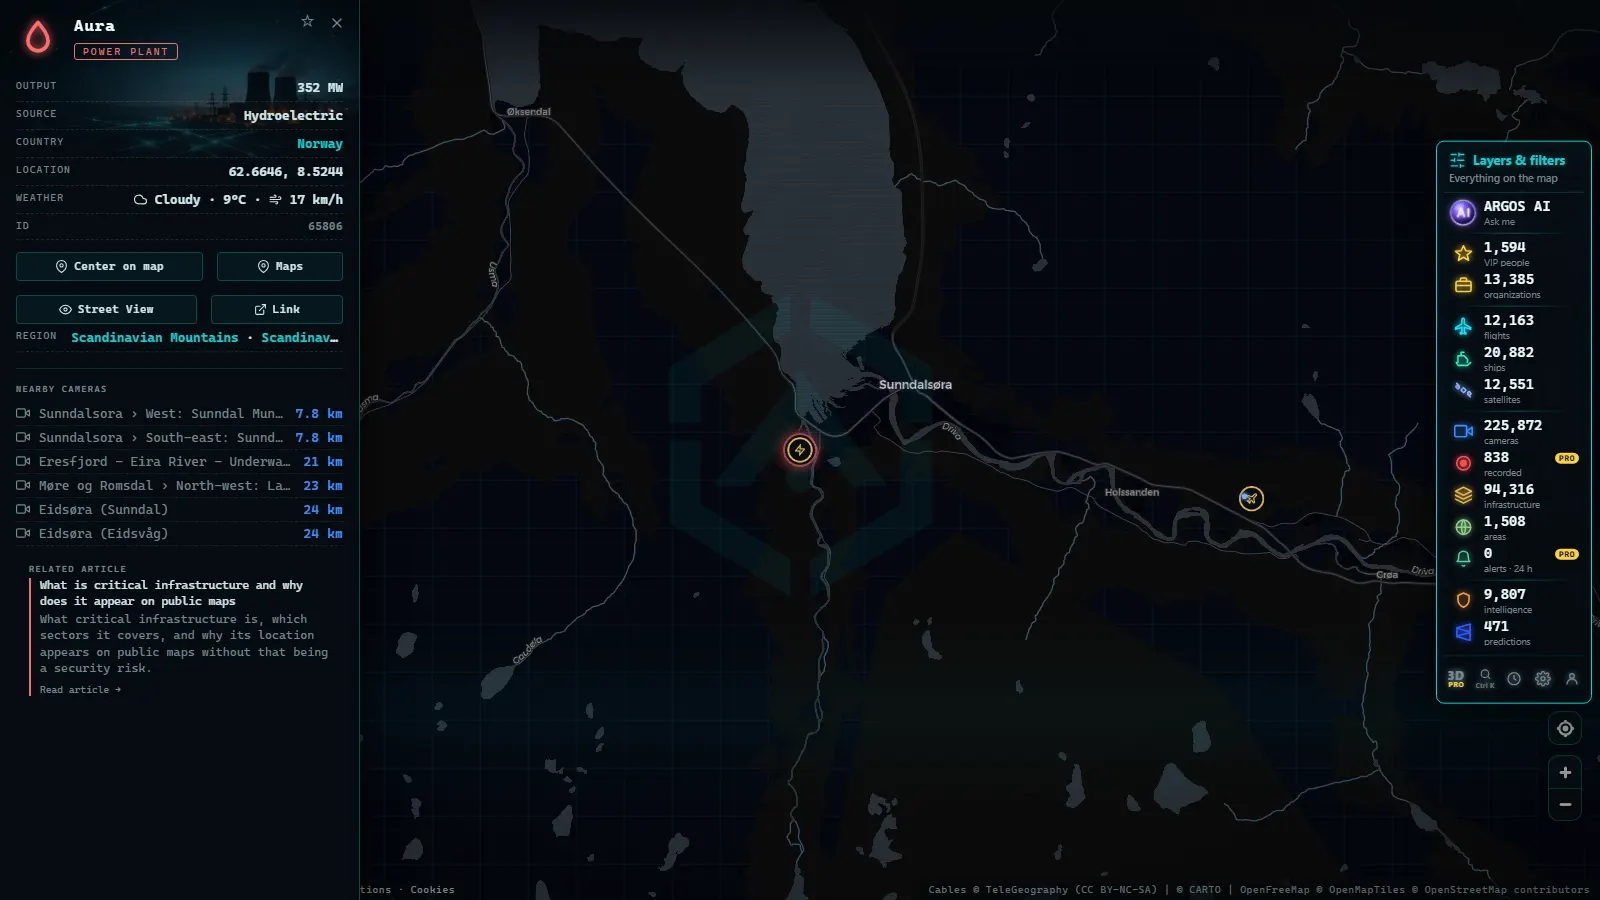
Aura works the high country towards Møre og Romsdal, taking water from the Aursjøen plateau and dropping it towards Sunndalsøra, where the smelter is the customer. The map gives it 352 MW.
Read both numbers for what they are: nameplate ceilings, the most those machines can do with enough water in the pipe. Real production swings with the reservoir, the season and the price, and none of that is in the card. What the card does give you is the exact position: how far the plant is from its dam, from the nearest road and from the nearest inhabited valley.
Reading the Norway power plants layer
| What the point shows | What it means in Norway | What to do with it |
|---|---|---|
| Fuel: hydro | Reservoir or run-of-river, fed by snow and rain | Expect a seasonal curve, not a flat output |
| Capacity in MW | Nameplate ceiling (Aura 352, Nedre Vinstra 343) | Rank plants by size, never read it as today's production |
| Name and position | No operator, no owner, no grid node | Use the position to find the dam and the access road |
| A dam close by | The storage half of the same scheme | Turn on the dam layer and look for the pair |
| A camera a few km away | A road camera, not a plant camera | Check light and weather before expecting a clear frame |
The habit worth building is to stop treating the point as the whole plant. In Norway a scheme is a reservoir, a tunnel, a powerhouse (often inside the rock) and a substation yard, spread over tens of kilometres. The map marks the powerhouse. Everything else you reconstruct by looking around it.
Winter and snowmelt: why June looks nothing like January
The Norwegian energy year has two halves. From October the snow piles up on the plateaus, reservoirs run down and the country leans on stored water. From May the melt arrives, rivers run full, spill gates open on the big schemes and the reservoirs refill. Nothing on the map is animated by that, but everything you see through a camera is: a frozen lake in Innlandet in February and the same lake brown with meltwater in June are the same megawatts at two different moments.
Light is the other half. In Finnmark and northern Nordland the midwinter sun barely clears the horizon, so frames go black for most of the day and come back usable around noon. In June the opposite: readable images at midnight.
The cameras near the plants are road cameras
Nobody points a public camera at a turbine. What exists in the Norwegian mountains are cameras for drivers, on the passes and the long valley routes, and they are useful precisely because they watch the snow and the water the plants live on.
Those three sit in Innlandet and Trøndelag, in the catchment country above the valley powerhouses. You will see snow depth, whether the pass is open, the surface of a mountain lake. You will not see a gate opening unless a road happens to run over the crest. The world map of dams and reservoirs is what to cross-check against when a camera shows you water you cannot name.
What you won't see
- No live output: no megawatts, no reservoir level, no spill status per plant.
- Still frames, not video, refreshed on each operator's own cycle, so an image can be minutes old.
- Nothing inside the fence: no camera in a powerhouse, a rock cavern or a substation yard, and nothing that identifies people or plates.
- Dark north in winter: hours of unusable black frames above the Arctic Circle, and snow or fog on the lens the rest of the time.
- No transmission lines, no subsea interconnectors to Europe and no substation network drawn on top.
- No operator, no ownership and no construction year in the point.
How to work it on the map
Start wide, then narrow. Open the energy layer over the fjords, click two or three Norwegian points and watch the fuel field repeat itself; that repetition is the whole argument of this article. Then pick one scheme, switch on the dam layer and look for the reservoir that feeds it. Finally check whether a public camera sits in the same valley.
The points named here
300 km
If you want the global frame first, the world energy map with located power plants is the wide view. Come back to Norway when you want to see what a country that runs on falling water actually looks like from above.
Frequently asked questions
Is the Norway power plant map free and live?
Yes, free and with no account. The power layer loads positions, fuel and capacity for Norwegian plants straight away, and nearby public cameras refresh their frames while you watch. What is not live is production: there are no megawatt readings or reservoir levels per plant, only the nameplate ceiling written on each card.
Why is almost all of Norway's electricity hydro?
Because the terrain pays for it. Heavy rain and snow on the western slopes, plateau lakes a thousand metres above the fjords and short steep rivers make stored water the cheapest firm power available. Thermal generation exists near cities and heavy industry, but it never became the backbone, and the reservoirs behave like a seasonal battery.
How much power do Nedre Vinstra and Aura produce?
The map lists 343 MW for Nedre Vinstra and 352 MW for Aura, and both figures are nameplate capacity, not output. That is the ceiling with enough water in the pipe. Actual generation changes with reservoir level, season and electricity price, and none of those appear on the card.
Can I see a Norwegian dam or reservoir on camera?
Sometimes, and indirectly. The cameras in the Norwegian mountains are road cameras on passes and valley routes, so you get the lake surface, the snow depth and the weather rather than the dam crest or the gates. When a road crosses a crest you get lucky; otherwise cross-check the dam layer.
Why does northern Norway look empty on the energy map?
Because it is, in population terms. Nordland, Troms and Finnmark hold large rivers and large plants, but with hundreds of kilometres between them and demand concentrated in a few towns and industrial sites. The south and west carry both the dense hydro clusters and the smelters built beside them.
- Why Blackouts Happen and How Power Grids Are Monitored 24/7
- Nuclear power plants around the world: where they are and how they are monitored
- How Long Do Power Outages Last in Puerto Rico? Causes & Management
- China Power Plants Map: What ARGOS Atlas Actually Shows
- Russia Power Plants Map: 545 Sites, Live Grid View
- Power Plants in the United States: What the Map Actually Shows