Blog · Energy & grids
Poland Power Plants Live Map: 4 EC Plants That Heat Cities
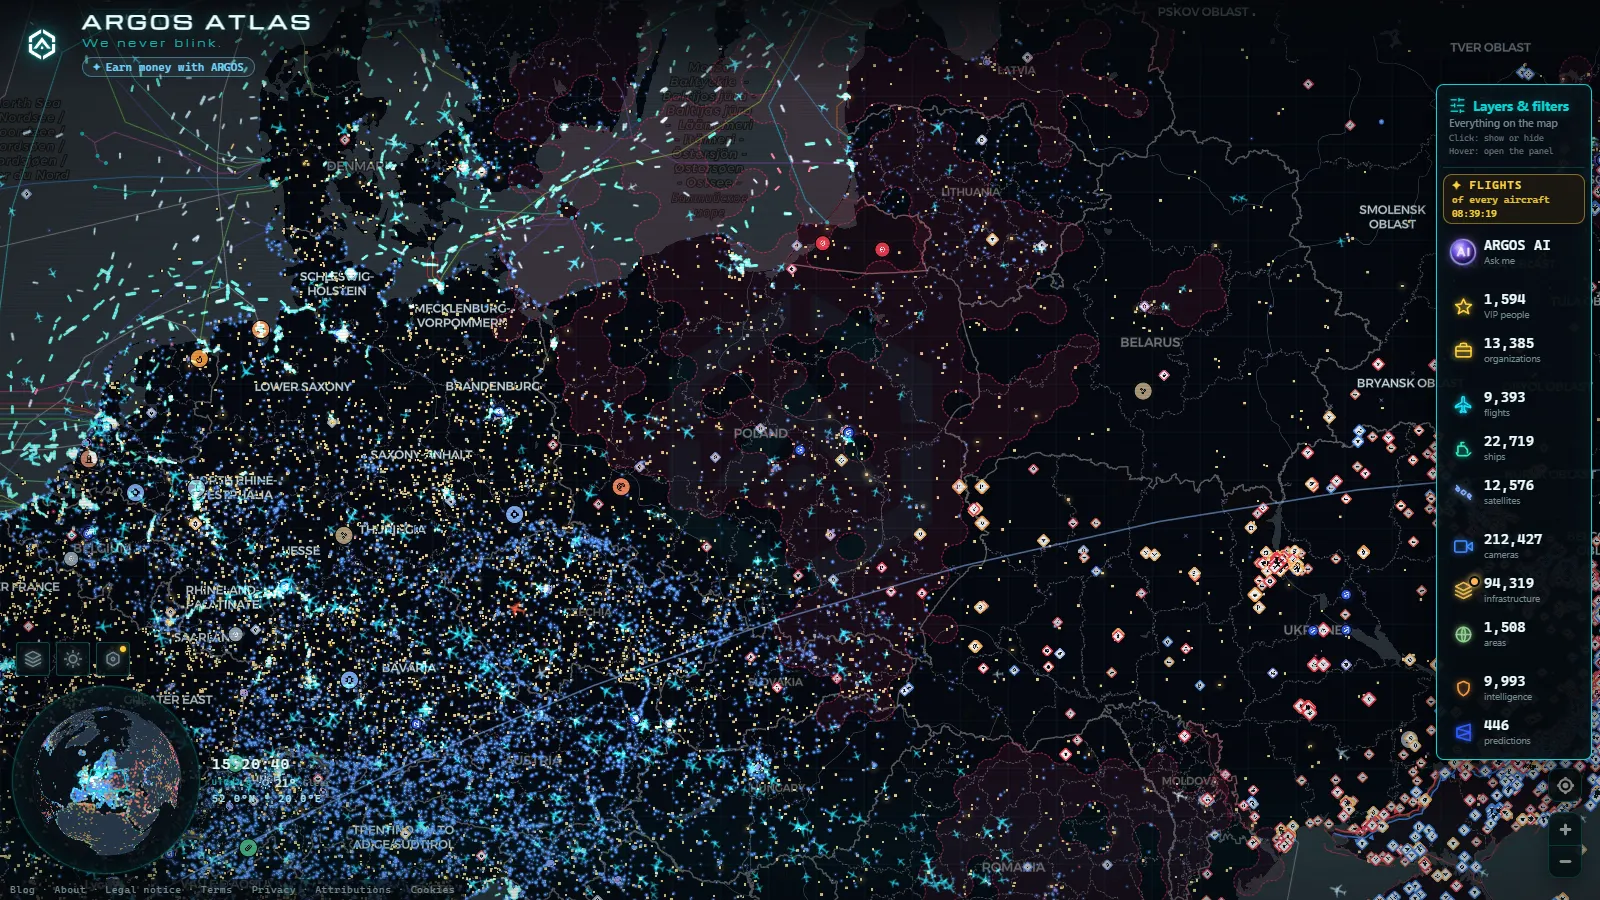
Poland's power plants are on the free ARGOS map as points you open one at a time: the coal blocks every ranking lists (Opole, Pątnów I, Kozienice II) and, more usefully, the urban cogeneration sites known as EC, short for elektrociepłownia, which heat whole cities through district networks as well as feeding the grid. No account, no payment, no trial: click a point and you get the operator, the fuel and the capacity where the source carries them.
This guide goes down to the installation instead of repeating the national capacity table. EC Wrocław, EC Żerań in Warszawa, Poznań Karolin (EC-II) and EC Białystok are the ones people actually open, so here is what each looks like on the live map, what its entry tells you, and what it quietly leaves out.
The essentials, in 20 seconds
- EC means elektrociepłownia: a plant that sells heat to a city network, not only electricity to the grid.
- 34,936 power installations worldwide sit on the same layer, so a plant in Wrocław reads with the same fields as one in Germany or Spain.
- EC Wrocław, EC Żerań, Poznań Karolin (EC-II) and EC Białystok stand inside or on the edge of the cities they warm.
- Opole, Pątnów I and Kozienice II are pure electricity: bigger, further out, owned by PGE, ZE Pątnów and Enea Wytwarzanie.
- Free and without registration: plants, dams, data centres and public cameras open in the same browser tab.
Why Poland power plants double as city heating
Most Polish cities run on district heating: hot water produced in one place and piped to blocks of flats, schools and offices. The plant producing it usually burns the same fuel to spin a turbine, so it lands in every power database as a generator. That is the elektrociepłownia, shortened to EC and written straight into the plant's name.
The practical consequence is geographic. These sites sit inside the built-up area, close to the housing they serve, with a chimney visible from the ring road, while a ranking sorted by megawatts pushes them to the bottom and leaves you staring at lignite blocks in the emptiest part of the country. If you want the categories rather than the sites, the guide to types of power plants covers them. The map carries the plant, never the heat network, so read the point as the source and the city around it as the customer.
EC Wrocław, the plant on the Odra
EC Wrocław stands north of the old centre, on the Odra, close enough that in January its plume is part of the skyline. On the map it is a point with an operator field (the KOGENERACJA company, inside the PGE group) and a fuel field that has been shifting from coal towards gas for years. That field is the one thing worth checking before you quote the plant anywhere, because databases update it late.
What the entry will not tell you is how much heat leaves the site, which districts it reaches, or whether a given block is running today. The closest honest proxy is the city itself: the public camera on the Rynek above shows the weather and the light the plant is working against, and nothing more than that. It is context, not monitoring, and it is worth saying so out loud.
EC Żerań, the plant behind right-bank Warszawa
EC Żerań sits in the north of Warszawa, in Białołęka, between the Wisła and the Żerań canal, which is why barges and the plant show up in the same corner of the map. Its operator, PGNiG Termika, has built a gas unit on the site, so an entry still tagged as coal is telling you about the history of the record rather than about the machine running today.
This is the most common trap with Poland power plants: the position is solid, the fuel label is a snapshot of whenever the source was compiled. Treat location and operator as reliable, fuel as a claim to verify, and capacity as installed rather than produced. On the right bank there are no public cameras pointed anywhere near the site, so what you can honestly do here is locate it, name it and follow the river traffic around it.
Poznań Karolin (EC-II) and EC Białystok
Poznań Karolin (EC-II) sits east of Poznań, in the Karolin district, run by Veolia's Poznań heating business. It is the largest of the four urban plants here and it heats a city whose demand peak arrives in the first cold week of the year, not in the summer, which inverts the usual intuition about when a generator matters.
EC Białystok, in Podlaskie, is the eastern outlier: the last significant heat source before the Belarusian border, operated by Enea Ciepło and burning coal alongside a biomass share. It is the clearest case for reading the fuel field with suspicion, since biomass co-firing tends to be recorded inconsistently. Both plants share the same honest limit as Wrocław and Żerań: the map places them, names the owner, and stops there.
The coal blocks: Opole, Pątnów I and Kozienice II
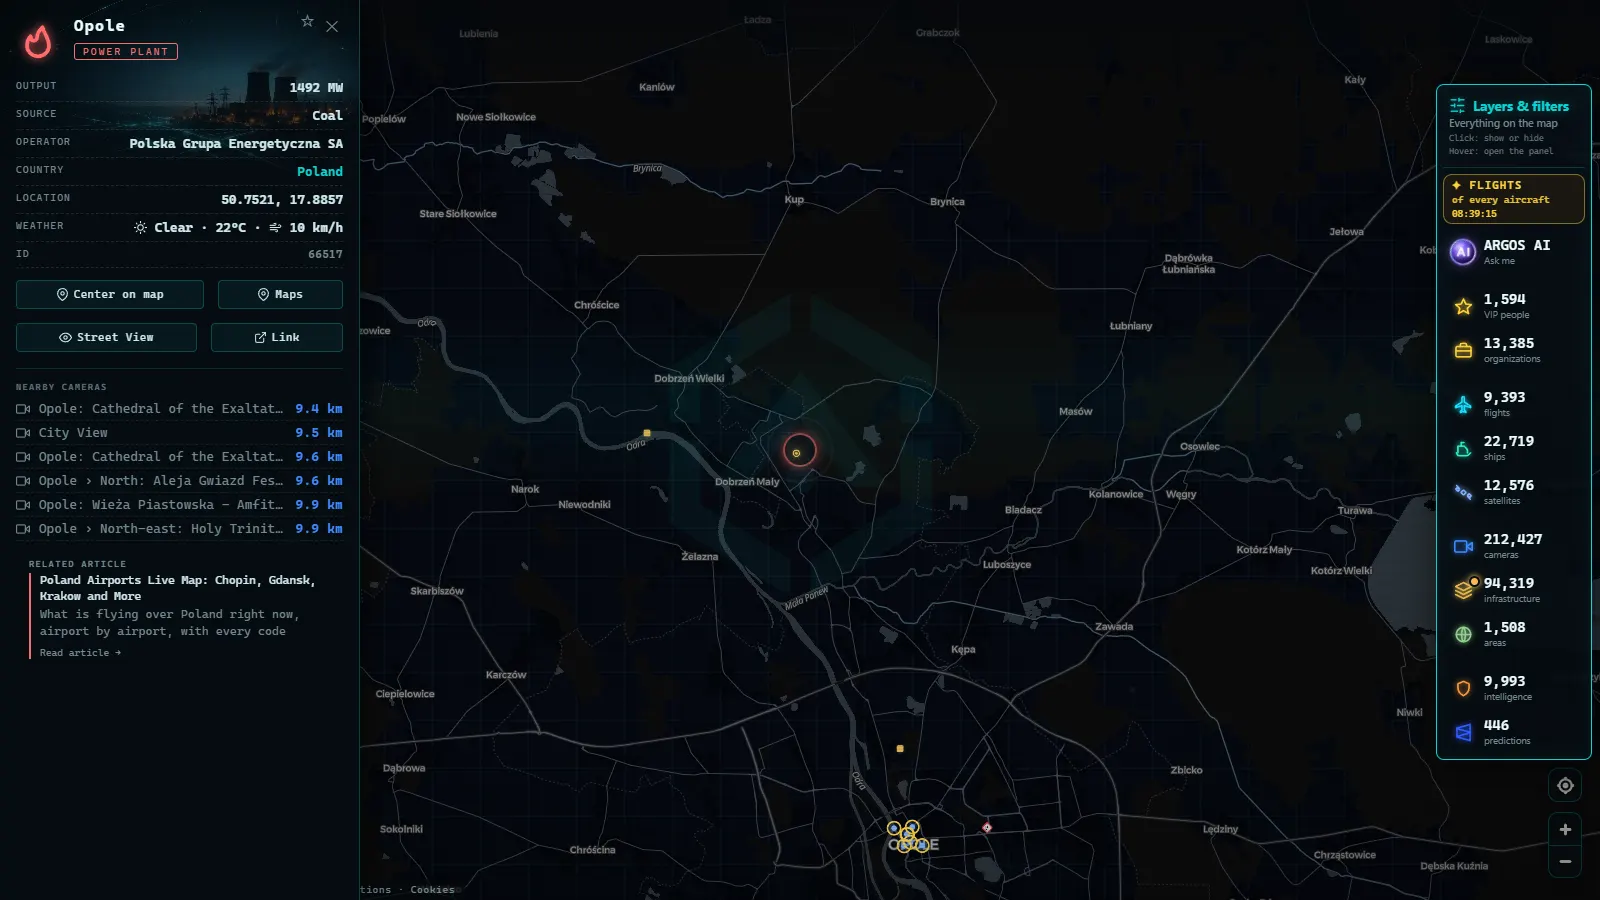
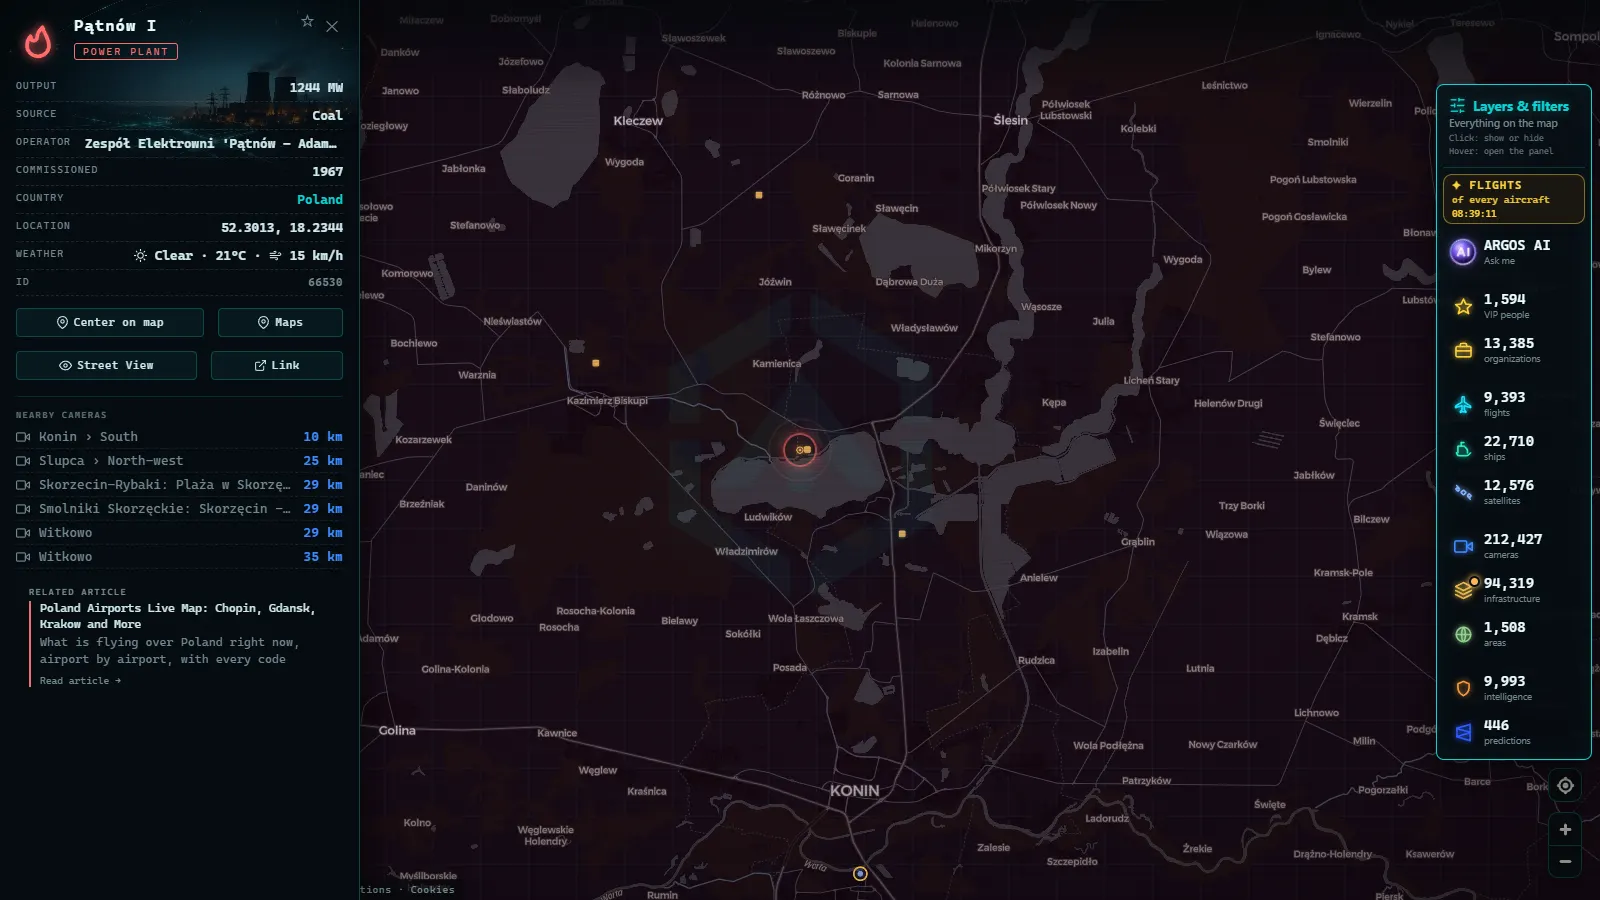
The sites that dominate any capacity table are a different animal. Opole in Opolskie, Pątnów I on the lakes near Konin, and Kozienice II on the Wisła in Mazowieckie are grid plants: big coal units, no city hanging off their hot water, built where fuel and cooling water were, not where people are.
Their entries are the richest on the Polish layer, with capacity, fuel and operator all filled in, which is exactly why they end up in every generic list. The card above is worth opening next to an EC entry: the contrast in what the two records contain says more about the Polish grid than a ranking does. The same reading works country by country on the world energy map.
Poland power plants on the map, site by site
Six sites, what their entry actually carries, and what to do with each one.
| Site | City, voivodeship | What the entry gives you | What to do with it |
|---|---|---|---|
| EC Wrocław | Wrocław, Dolnośląskie | Position, operator, fuel | Open it on the live map and check the fuel before quoting coal |
| EC Żerań | Warszawa, Mazowieckie | Position by the Wisła and the canal | Compare the label with the gas unit its operator built |
| Poznań Karolin (EC-II) | Poznań, Wielkopolskie | Position east of the centre, operator | Measure how far the heat has to travel across the city |
| EC Białystok | Białystok, Podlaskie | Position, operator, fuel | Look for whether biomass appears at all |
| Opole | Opole, Opolskie | Capacity, coal, operator PGE | Read it as grid electricity, never as city heat |
| Kozienice II | Świerże Górne, Mazowieckie | Capacity, coal, operator Enea Wytwarzanie | Use it as the yardstick against any EC above |
The cameras near the plants, and what they are for
There are public cameras in Lower Silesia, and they are not watching the plants. They watch roads and squares: Szewce north of Wrocław, Oleśnica and Oława on the approaches, plus the market square already embedded above.
They are still useful in an energy article for one reason: they show the conditions the heating system is answering to, fog, snow on the carriageway, the first genuinely cold morning. Across the whole product there are 212,142 cameras catalogued (count as of September 2026), and the Polish ones are documented in the guide to traffic cameras in Poland. None of them belongs to an energy company, and none ever will.
Dams, data centres and the rest of the picture
The same layer stack carries 5,356 dams and 4,072 data centres, which fills in the parts of the Polish energy story a plant list misses. The Pilchowice dam on the Bóbr, in Lower Silesia, is the historic hydro entry most people open; north of it, in Jelenia Góra's mountains, the Czech dams sit close enough to appear in the same view.
On the demand side, Warszawa's data centres are the loads growing fastest, and their surface area is recorded where the source has it. Poland's airports, already mapped in the Poland airports guide, are the third big consumer worth putting on the same screen. None of these carry live consumption either, only what and where.
What you won't see
- No live output: capacity is the installed figure on record, not megawatts flowing right now.
- No heat networks: the pipes, the districts served and the temperature of the water are nowhere on the map.
- No emissions, no outages: nothing changes on screen when a block trips or a plant shuts for maintenance.
- No plant cameras: every feed is a road or city camera, still frames rather than video, and nobody is identifiable in them.
- Gaps in the records: smaller Polish plants can arrive without operator or capacity, and a fuel field can be years out of date.
- Night: city cameras go dark or grainy after sunset, and some operators simply stop serving frames until morning.
Checking Poland power plants in under a minute
Open the map, move to Poland, and switch on the energy layer. Click the point you care about and read three fields in this order: operator (the most stable), position (reliable), fuel (the one to doubt). If the name starts with EC, assume a city is attached to it and look at what surrounds the point, because the housing blocks are the real clue to what the plant does.

Then compare one urban plant with one coal block. That single comparison, Wrocław against Opole, teaches more about how the country generates and heats than any megawatt table, and it takes about as long as reading this paragraph.
Frequently asked questions
Is the map of Poland power plants free and live?
Yes, free and with no registration, but \"live\" means different things per layer. The plant points and their operator, fuel and capacity fields are a catalogue, not a telemetry feed. The public cameras refresh as still frames while their operator keeps them up, and the flight and vessel layers are the ones that move by the second.
What does EC mean in a Polish plant name?
It is short for elektrociepłownia, a combined heat and power plant. It generates electricity and, at the same time, hot water for a district heating network, which is why EC Wrocław, EC Żerań and EC Białystok sit inside the cities they serve instead of next to a mine or a river far away.
Can I see how much electricity a Polish plant is producing right now?
No. The map carries the installed capacity recorded for the site, not its output at this minute. Nothing in the layer updates when a block starts or stops, and there is no outage feed behind it. For real time generation you need the Polish grid operator's own publications, which are outside this map.
Which Polish power plants are the biggest on the map?
The coal blocks, not the city plants. Among the sites in this guide, Opole, Pątnów I and Kozienice II carry the largest capacity figures, operated by PGE, ZE Pątnów and Enea Wytwarzanie. The urban EC plants are smaller in megawatts but serve more people directly, because their heat output never shows up in an electricity ranking.
Are there cameras inside the power plants?
No. Every camera on the map is a public feed from a road authority or a city, pointed at streets and squares, never at plant interiors or perimeters. Near Wrocław that means the market square and the roads through Szewce, Oleśnica and Oława: useful for weather and light, useless for watching a chimney.
- World map of dams and reservoirs: 5,356 points you can open
- South America Power Plants: Country by Country on the Map
- Norway power plants on the map: hydro, dams and live views
- World Power Plant Map: See Every Major Plant Live
- Why Blackouts Happen and How Power Grids Are Monitored 24/7
- Nuclear power plants around the world: where they are and how they are monitored