Blog · Energy & grids
Russia Power Plants Map: 545 Sites, Live Grid View
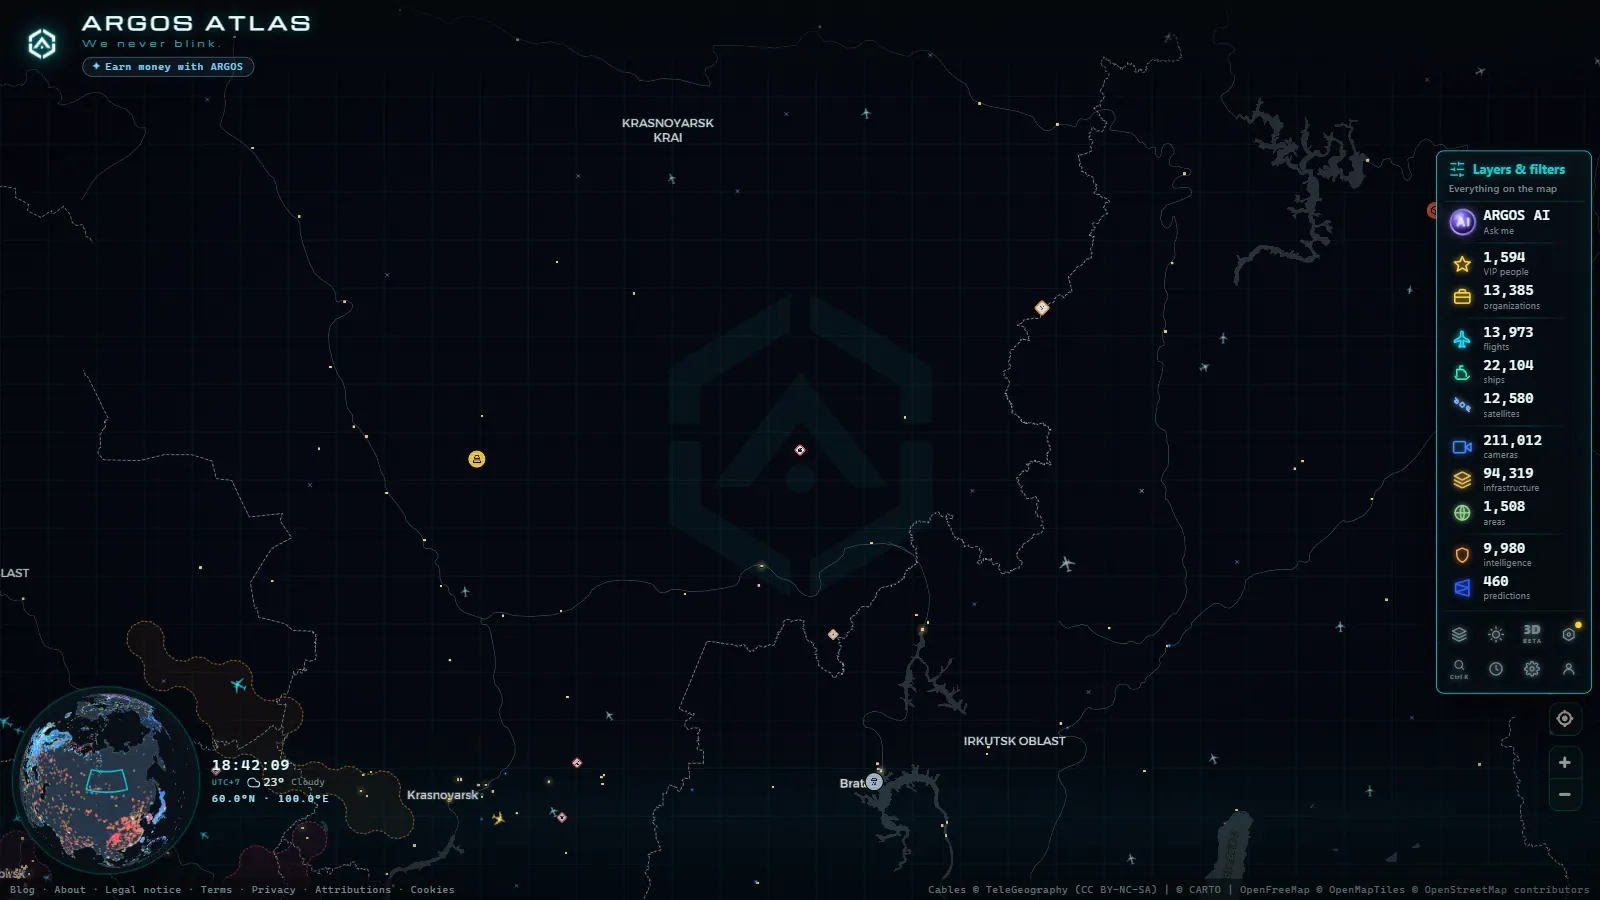
Type "russia power plants map" into a search bar and most results are either outdated energy-industry PDFs or world maps that stop resolving detail once they cross a border. ARGOS ATLAS keeps a live map with 545 power plants catalogued inside Russia (recuento a agosto de 2026), hydro dams on the Volga and Angara, gas-fired stations feeding the western grid, coal plants around Kuzbass, and the country's nuclear fleet. Here's what's actually on the card when you click a dot, what's missing, and why this particular grid draws more attention than almost any other one on the map.
The essentials, in 20 seconds
- 545 power plants across Russia are catalogued with location, fuel type and capacity on the map
- Gas dominates by count around Moscow and western Russia, while coal clusters around the Kuzbass basin
- Sayano-Shushenskaya, Bratsk and Krasnoyarsk, giant hydro dams on the Angara and Yenisei, anchor Siberia's grid
- Six nuclear plants (Kursk, Leningrad, Novovoronezh, Rostov, Kalinin, Balakovo) each sit far apart, anchoring their own regional grid
- The map is free with no login, but shows installed capacity, not live output, operational status or outage reports
What the Russia Power Plants Map Actually Shows
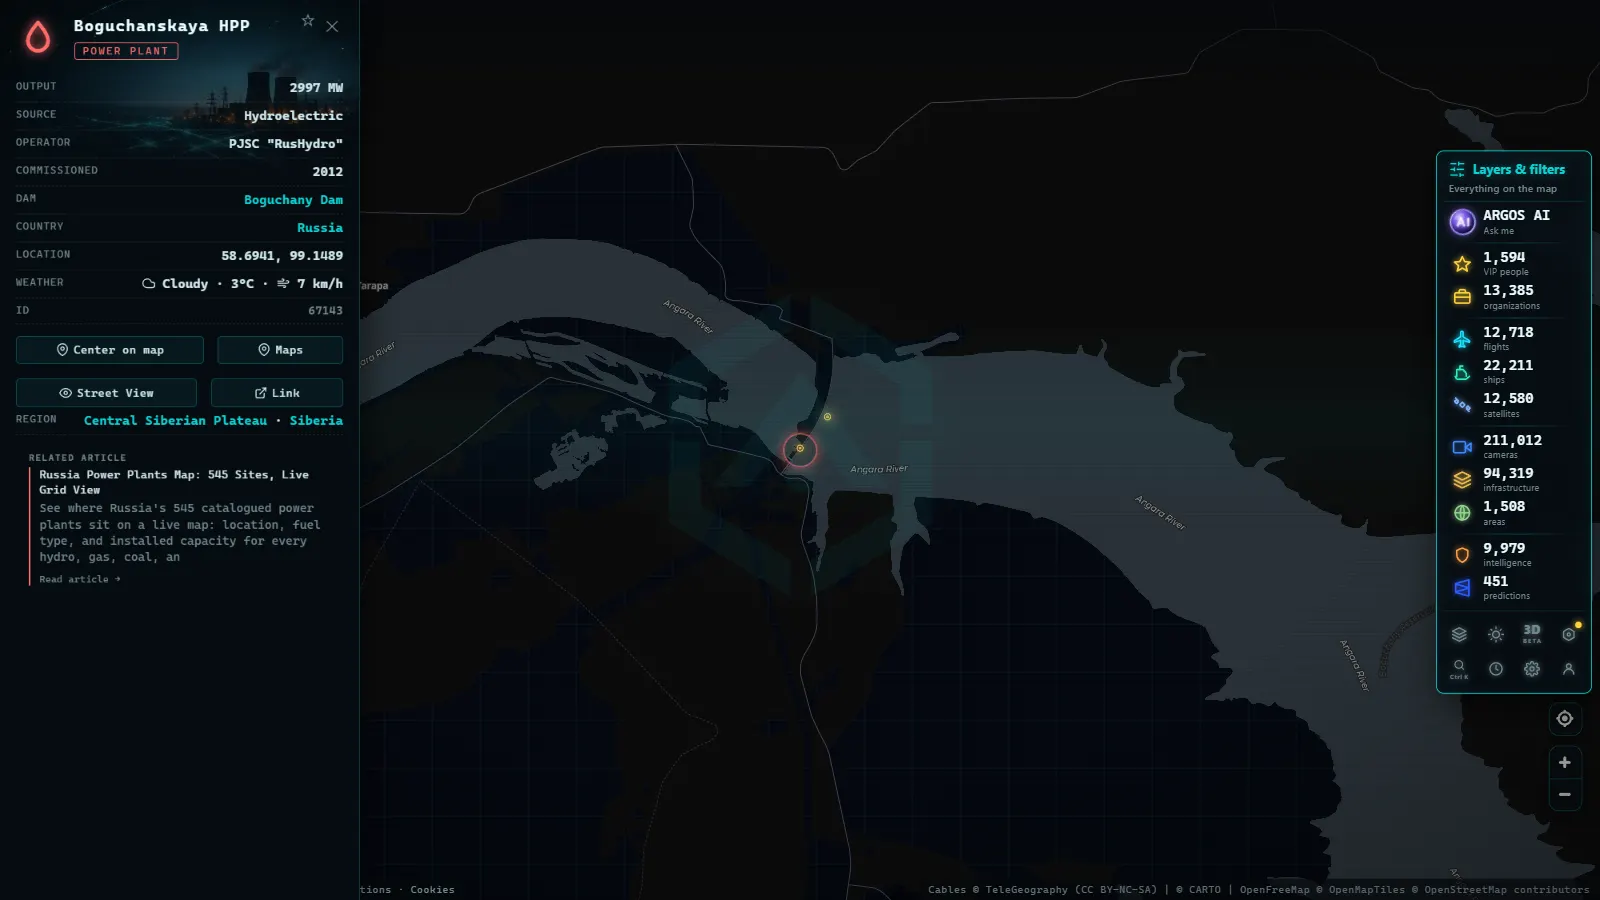
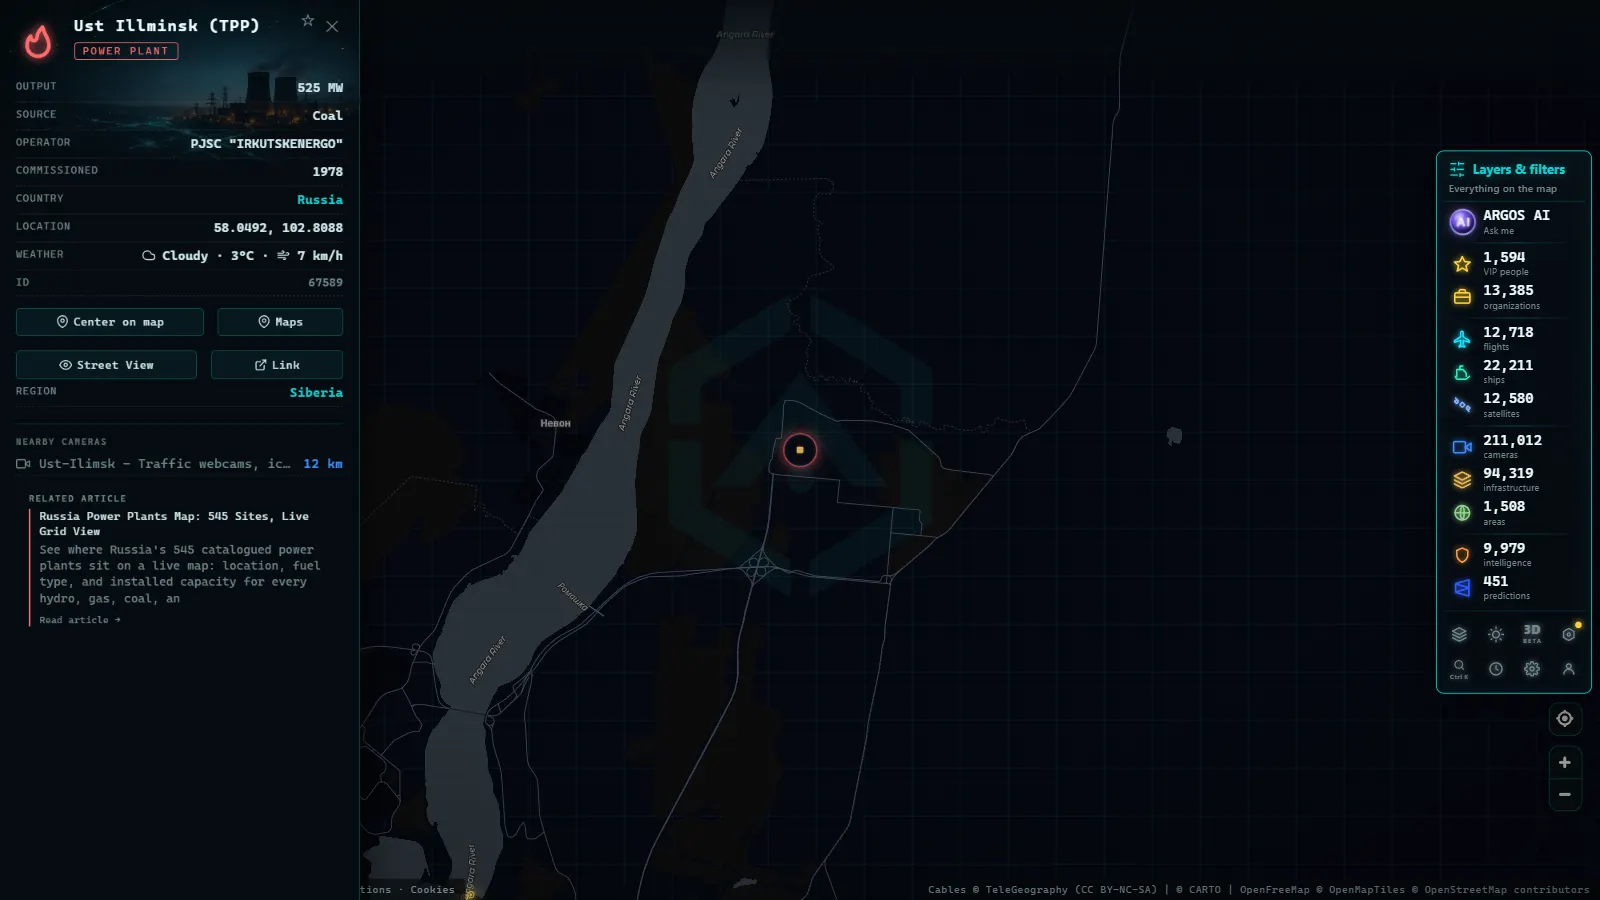
Open the map and switch on the power layer: every catalogued site in Russia drops in as a pin, color-coded by fuel type. Click one and the card gives you location, plant type (hydro, gas, coal, nuclear, oil, or other), installed capacity in megawatts where it's known, and the plant's name or operator when that data exists. No login, no paywall, it's the same free access as every other layer on ARGOS ATLAS.
That's a static catalogue, not a feed. It tells you where a plant sits and roughly how big it is on paper. It doesn't tell you whether it's running today.
Where Russia's Power Plants Sit
Plot all 545 sites and the pattern is immediately geographic rather than random. The densest cluster sits in European Russia, the Moscow region, the Volga basin, and the corridor around St. Petersburg, where population and industry have concentrated generation for decades. Move east and pins thin out fast: Siberia's contribution comes mostly from a handful of very large hydro stations strung along the Angara and Yenisei rivers, built to power heavy industry rather than cities. Past Lake Baikal, coverage gets sparse again, with the Far East running largely on isolated regional grids that barely connect to the rest of the country. The Arctic north has almost nothing.
That geography is the story more than any single number: Russia's grid isn't one interconnected system so much as several regional systems loosely stitched together, with the west carrying most of the load.
Hydro, Gas, Coal, and Nuclear: the Mix
The 545 sites on the map split across the same four fuel types you'd expect from a Soviet-era grid still largely intact. Gas dominates by count, feeding the dense cluster of stations around Moscow and the west. Coal shows up heavily around the Kuzbass basin in southwestern Siberia, where the fuel is mined locally. Hydro is fewer stations but outsized on the map: the Volga cascade and the giant Siberian dams (Sayano-Shushenskaya, Bratsk, Krasnoyarsk among the names you'll recognize) are some of the biggest single pins in the whole catalogue. Nuclear is the smallest group by count but still spread wide, plants like Kursk, Leningrad, Novovoronezh, Rostov, Kalinin, and Balakovo sit far apart from each other, each anchoring its own chunk of grid.
For the mechanics of how each of those fuel types actually turns into electricity, our guide to power plant types breaks it down plant by plant. If nuclear specifically is what you're after, the world nuclear power map covers Russia's reactors alongside every other country still running them.
Why This Grid Gets Watched More Than Any Other
Most national grids don't get much traffic on a map. Russia's does, for reasons that have nothing to do with curiosity about hydro cascades. The country has been at war since 2022, its energy sector is under sanctions, and its own utilities don't publish the kind of open operational dashboards that grids in the EU or North America do. There's no equivalent of a national ISO data feed to check against. A catalogue that just shows where the plants are (full stop) fills a gap that would otherwise be empty.
It's also a useful comparison point against a grid built on the opposite logic. China's power plant map is the story of a system still being built out at enormous scale; Russia's is the story of a system built decades ago that hasn't been meaningfully expanded since, and is now operating under conditions nobody designed it for.
What This Map Doesn't Show
This is the part we won't dress up. The Russia power plants map is a location and capacity catalogue, not a monitoring system. It does not show:
- Live output. Installed capacity is a nameplate number (what a plant could generate at full tilt) not what it's producing right now.
- Operational status. A pin on the map doesn't tell you if a plant is running, idled for maintenance, or offline.
- Damage or outage reports. If a station has been hit or shut down, that isn't reflected here. We don't have a source for it.
- Grid frequency or load. No real-time balancing data, no demand curves.
If you want the general mechanics of how outages happen and how grids get monitored where that data is public, our piece on why blackouts happen is the place to start, it's not Russia-specific, but the underlying physics is the same everywhere.
How This Fits Next to the Front Line
Energy infrastructure being a target in war is not speculation, it's a documented, publicly reported fact on both sides of the conflict, covered by wire services and tracked by international energy agencies. What the map adds isn't a prediction of what happens next to any given plant. It's simply a clearer picture of where that infrastructure physically sits than most people have ever had access to, sitting on the same live map that tracks front-line positions in the world's active conflicts. We're not going to speculate on individual sites here, that's not what this catalogue is for.
The Plant Card, at a Glance
| On the card | Not on the card |
|---|---|
| Location (latitude/longitude) | Live power output |
| Plant type (hydro, gas, coal, nuclear, oil, other) | Operational status (running/offline) |
| Installed capacity in MW, where catalogued | Damage or outage reports |
| Plant name / operator, where available | Real-time grid frequency or load |
For the bigger picture beyond Russia, the world energy map plots every major power station ARGOS ATLAS has catalogued, country by country, on the same free layer.
Frequently Asked Questions
Is the Russia power plants map free, live, and does it need sign-up? Yes. The map at /map/ is free with no registration. The power layer itself is a catalogue rather than a live feed (pins update as we add or correct sites, not in real time) but browsing it costs nothing and needs no account.
How many power plants does the map show for Russia? 545, as of our most recent count (recuento a agosto de 2026). That number covers catalogued sites with a known location; it will grow as we add more.
Does the map show which Russian plants are nuclear, hydro, gas, or coal? Yes, each pin carries a fuel-type badge, and clicking through gives installed capacity where it's known. It doesn't break down what share of Russia's total capacity each fuel type represents, we only publish counts we can verify.
Can I see if a power plant in Russia is damaged or currently offline? No. The map shows location and installed capacity, not operational status. We don't have a live source for outages, damage, or whether a given plant is actually generating right now, and we're not going to guess.
Why do so many people search for Russia's power grid on a map? Mostly the war and the sanctions around it, there's no equivalent open operational dashboard from Russian utilities the way there is in the EU or North America, so a location catalogue is one of the few public references available.
Frequently asked questions
Is the Russia power plants map free, live, and does it need sign-up?
Yes. The map at /map/ is free with no registration. The power layer itself is a catalogue rather than a live feed (pins update as we add or correct sites, not in real time) but browsing it costs nothing and needs no account.
How many power plants does the map show for Russia?
545, as of our most recent count (recuento a agosto de 2026). That number covers catalogued sites with a known location; it will grow as we add more.
Does the map show which Russian plants are nuclear, hydro, gas, or coal?
Yes, each pin carries a fuel-type badge, and clicking through gives installed capacity where it's known. It doesn't break down what share of Russia's total capacity each fuel type represents, we only publish counts we can verify.
Can I see if a power plant in Russia is damaged or currently offline?
No. The map shows location and installed capacity, not operational status. We don't have a live source for outages, damage, or whether a given plant is actually generating right now, and we're not going to guess.
Why do so many people search for Russia's power grid on a map?
Mostly the war and the sanctions around it, there's no equivalent open operational dashboard from Russian utilities the way there is in the EU or North America, so a location catalogue is one of the few public references available.
- Power Plants in the United States: What the Map Actually Shows
- Power plants in Italy map: 4 plants in a 34,936-site layer
- Power Plants in Turkey Map: Dams, Coal, Gas and Nuclear Sites
- Poland Power Plants Live Map: 4 EC Plants That Heat Cities
- World map of dams and reservoirs: 5,356 points you can open
- South America Power Plants: Country by Country on the Map