Blog · Energy & grids
Power Plants in the United States: What the Map Actually Shows
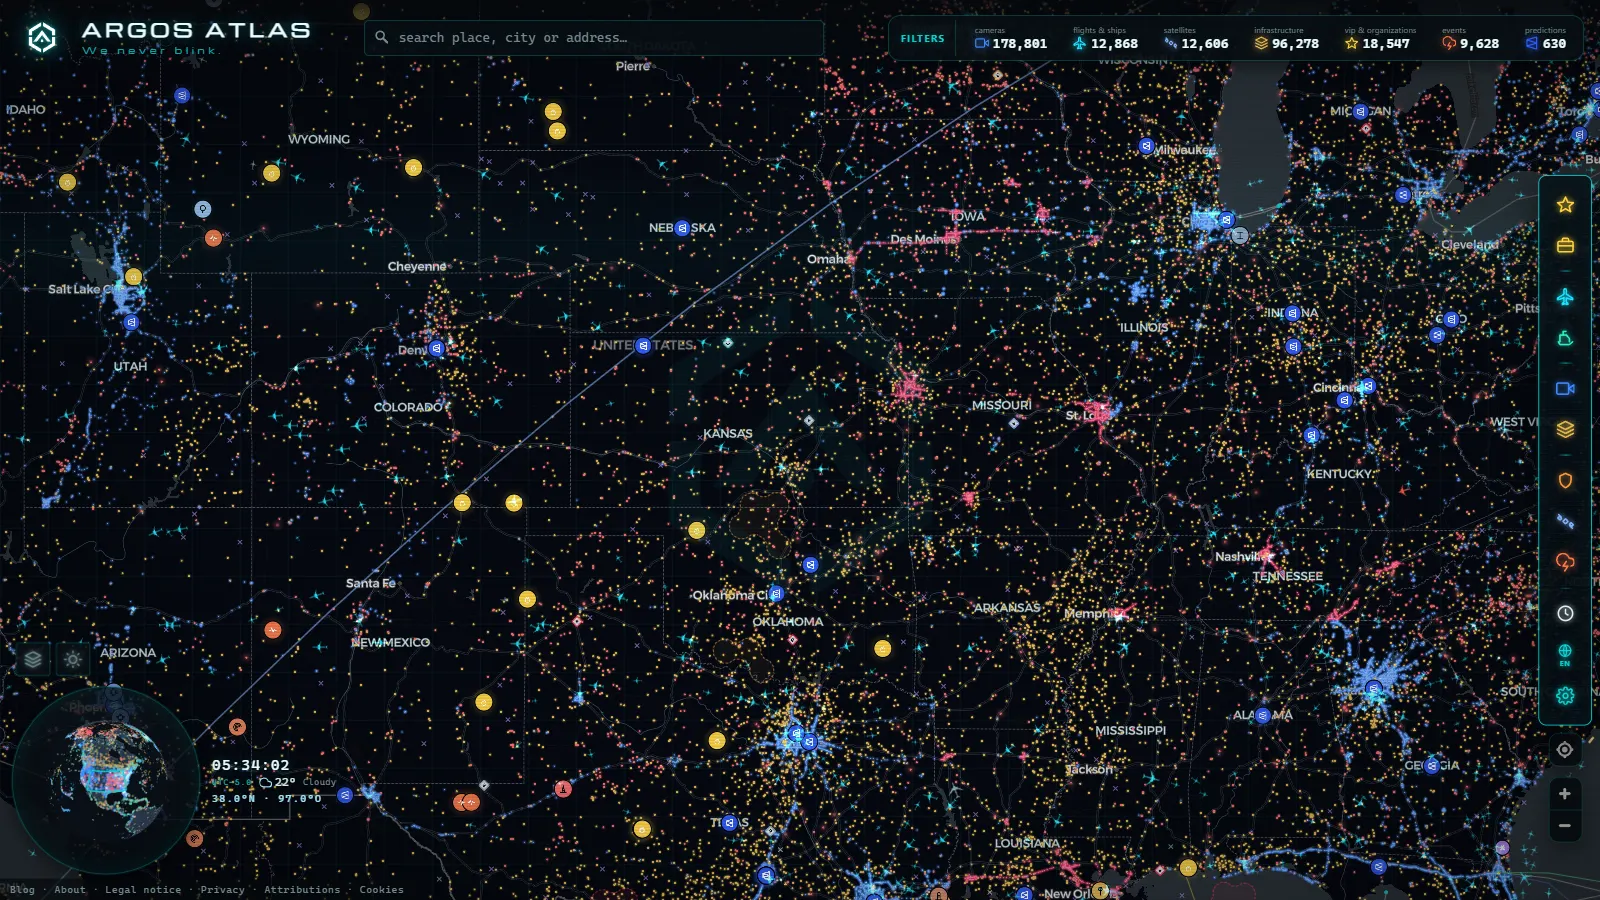
The United States has more power plants on the ARGOS ATLAS map than almost any other country, and the reason isn't just size. It's the mix. Nowhere else do you see natural gas turbines, coal units built decades ago, the country's newest nuclear reactors, wind farms stretching across the Great Plains, and desert solar arrays all sitting on the same live map, at the same zoom level. This is a guide to reading that map: what it plots, how generation splits by type, where the power actually concentrates, and where the map's honesty runs out.
Power plants in the United States: what the map actually plots
Open the map and every marker is a real, named facility: a plant with a location, a generation type, and a declared capacity in megawatts. That's an inventory of built infrastructure, sourced from public grid and energy records, not a live feed of what each plant is producing right now. Zoom into Texas or the Ohio Valley and the markers cluster so tightly they start to overlap, and that clustering is itself information, because it shows you the backbone of the US grid in a way a spreadsheet never will.
The country's plants aren't evenly spread. They follow fuel, water, and demand: gas near the wells and coastal Gulf infrastructure, coal near old rail lines and the Appalachian seams that fed it for a century, hydro wherever a river drops enough, wind where the plains funnel it, solar where the sun is reliable and land is cheap. Reading the map by region tells you more about American energy geography than any single number would.
How generation splits by type across the US map
No two states generate electricity the same way, and the map makes that visible instantly. Some regions lean on a single technology that dominates the local skyline; others blend four or five. The table below is a reading guide: where each generation type tends to concentrate on the map, and what quietly caps how much of its installed capacity it actually delivers.
| Generation type | Where it concentrates on the map | What limits how much it actually delivers |
|---|---|---|
| Natural gas | Texas, the Gulf Coast, the Southeast | Runs on demand, but dispatch shifts with fuel prices |
| Coal | Appalachia, the Midwest | An ageing fleet; many units now run only part of the year |
| Nuclear | Southeast, Midwest, Northeast | High, steady output, but almost no new plants are being built |
| Hydroelectric | Pacific Northwest, Tennessee Valley | Tied to snowpack and river flow, not constant year-round |
| Wind | Texas panhandle, the Great Plains wind corridor | Output follows the wind, not grid demand |
| Solar | California, Southwest desert basins | Peaks at midday, falls to zero overnight |
That last column matters more than it looks. A plant's marker on the map carries its installed capacity, the maximum it was built to produce, not what it delivers on an average day. Nuclear and gas plants tend to run close to that ceiling most of the time; wind and solar rarely do, by design, because their fuel is the weather. That gap between installed and delivered power is the single most misread part of US energy coverage, and it's worth sitting with before drawing conclusions from plant counts alone.
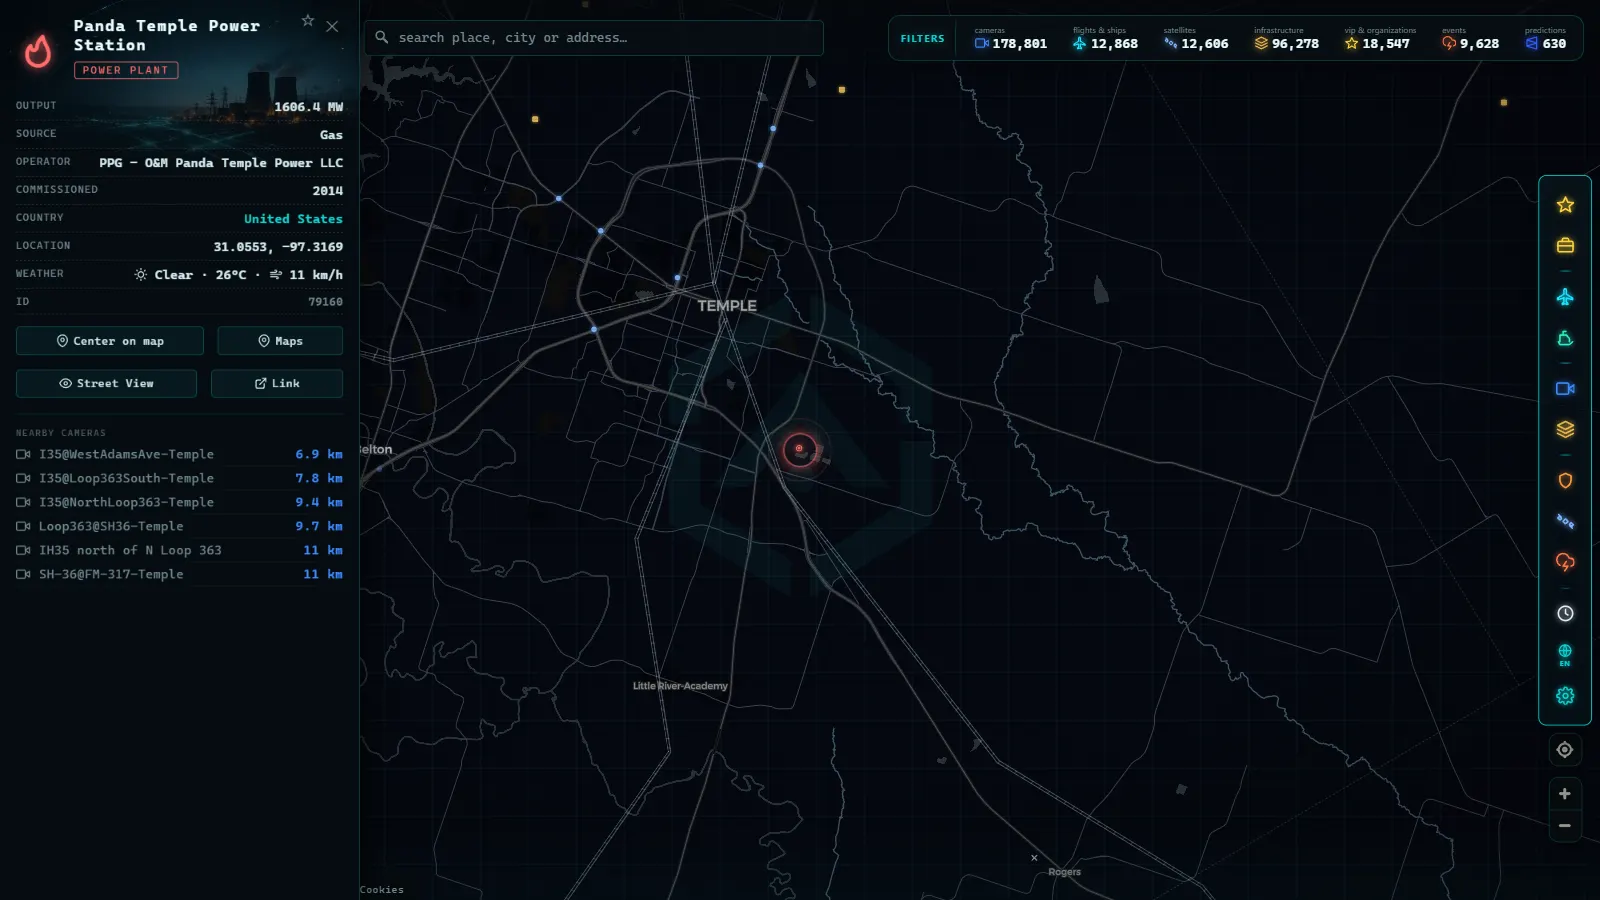
Where power plants in the United States actually concentrate
Four regions carry a disproportionate share of what you'll see clustered on the map:
- Texas. Its own grid, run separately from the rest of the country, mixes gas, wind, and a fast-growing solar buildout, one of the densest clusters of markers anywhere on the map.
- The Appalachian corridor. Coal country, still dotted with plants built for a coal economy that has been shrinking for decades; some markers here represent capacity that runs only a fraction of the year.
- The Pacific Northwest. Dominated by hydroelectric dams on the Columbia and Snake river systems, a region where the map's markers trace the rivers almost exactly.
- California and the Desert Southwest. The country's densest concentration of solar, plus a handful of large gas plants that fill in when the sun goes down.
Puerto Rico is worth a separate look, precisely because it isn't part of the mainland grid. Its plants, transmission lines, and the outages that follow storms are a case study in what happens when a grid has no neighbors to lean on, we've covered why blackouts drag on for so long in Puerto Rico in more detail, and the pattern generalizes: isolated grids recover slower than interconnected ones, and the map's plant markers alone don't tell you which kind of grid you're looking at.
The gap between installed capacity and power actually delivered
This is the distinction that separates a useful reading of the US map from a misleading one. Every plant marker shows installed capacity, the nameplate figure, the maximum the equipment was engineered to produce. It does not show output: what the plant is actually generating at three in the afternoon on a Tuesday. A gas plant built to cover peak summer demand might sit mostly idle for eight months and still carry the same marker, the same declared capacity, as one that runs at full tilt around the clock.
This matters most for wind and solar, because the share of installed capacity they actually deliver over time is structurally lower than gas, coal, or nuclear. A wind farm with a large capacity number on the map is not "worth" the same as a nuclear plant with the same number; one runs when the wind blows, the other runs almost continuously. None of this is visible from the map alone, and it's exactly the kind of gap that turns a plant count into a misleading headline if you don't know to look for it.

What the map does not show
Being upfront about the limits here is the point, not an afterthought. The map is an inventory: plants, their type, their location, their declared capacity. It is not a live feed of generation. You will not see how many megawatts a specific US plant is producing right now, whether a unit is offline for maintenance, or how the grid operator is dispatching power between plants minute to minute, that data either isn't public in real time or isn't published in a form that can be mapped reliably. The electricity layer is a snapshot of what's built, not a stream of what's running.
That distinction is also why the map is a better tool for understanding grid structure than for predicting an outage. For the mechanics of why grids fail in the first place (the difference between a generation shortfall and a transmission failure) our explainer on why blackouts happen covers the underlying causes the plant map alone can't diagnose.
Comparing the US map to the rest of the world
The United States isn't unique in having a diverse generation mix, but its scale makes the diversity easier to see. Countries built around one or two dominant technologies read very differently on the same map, see how China's power plants skew toward coal and a rapid renewables buildout, for contrast. For the mechanics of how each generation type actually works, from turbines to fuel cycles, our guide to power plant types is the companion piece to this one. And if you want the planet-scale view before zooming into any one country, the world energy map is where to start.
To explore any of this yourself (click into a plant, check its type and declared capacity, or just watch how the clusters shift as you pan across the country) the fastest way in is the live power plants map of the United States.
FAQ
Is the power plants map of the United States free, live, and does it need an account? Yes. The map is free, requires no signup, and stays open in the browser, you can pan across the country and click into any plant without creating an account. What "live" means here is worth being precise about: the map itself updates continuously, but that refers to the inventory of plants and their declared capacity, not a real-time feed of how much electricity each one is generating right now.
How many power plants does the map show for the United States? The map lists a large, ongoing inventory of US facilities across every generation type, from gas and coal to nuclear, hydro, wind, and solar. We don't publish a single verified national count here, because the honest way to read that number depends on which generation types and plant sizes you include.
Does the map show real-time electricity generation for each plant? No. Each marker carries a plant's location, generation type, and installed capacity, not what it's producing at this moment. Minute-by-minute dispatch and output aren't published in a form that can be mapped reliably.
Which US states have the most power plants on the map? Texas stands out for density and mix, running its own grid with heavy gas, wind, and growing solar. Appalachia concentrates coal, the Pacific Northwest concentrates hydro, and California and the Desert Southwest concentrate solar.
What's the difference between installed capacity and actual power output? Installed capacity is the maximum a plant was built to produce. Actual output is what it delivers day to day, which for wind and solar runs well below that ceiling because their fuel (sun and wind) isn't constant, while gas, coal, and nuclear plants typically run closer to their rated capacity.
Frequently asked questions
Is the power plants map of the United States free, live, and does it need an account?
Yes. The map is free, requires no signup, and stays open in the browser, you can pan across the country and click into any plant without creating an account. What \"live\" means here is worth being precise about: the map itself updates continuously, but that refers to the inventory of plants and their declared capacity, not a real-time feed of how much electricity each one is generating right now.
How many power plants does the map show for the United States?
The map lists a large, ongoing inventory of US facilities across every generation type, from gas and coal to nuclear, hydro, wind, and solar. We don't publish a single verified national count here, because the honest way to read that number depends on which generation types and plant sizes you include.
Does the map show real-time electricity generation for each plant?
No. Each marker carries a plant's location, generation type, and installed capacity, not what it's producing at this moment. Minute-by-minute dispatch and output aren't published in a form that can be mapped reliably.
Which US states have the most power plants on the map?
Texas stands out for density and mix, running its own grid with heavy gas, wind, and growing solar. Appalachia concentrates coal, the Pacific Northwest concentrates hydro, and California and the Desert Southwest concentrate solar.
What's the difference between installed capacity and actual power output?
Installed capacity is the maximum a plant was built to produce. Actual output is what it delivers day to day, which for wind and solar runs well below that ceiling because their fuel (sun and wind) isn't constant, while gas, coal, and nuclear plants typically run closer to their rated capacity.
- Power plants in Italy map: 4 plants in a 34,936-site layer
- Power Plants in Turkey Map: Dams, Coal, Gas and Nuclear Sites
- Poland Power Plants Live Map: 4 EC Plants That Heat Cities
- World map of dams and reservoirs: 5,356 points you can open
- South America Power Plants: Country by Country on the Map
- Norway power plants on the map: hydro, dams and live views