Blog · Energy & grids
China Power Plants Map: What ARGOS Atlas Actually Shows
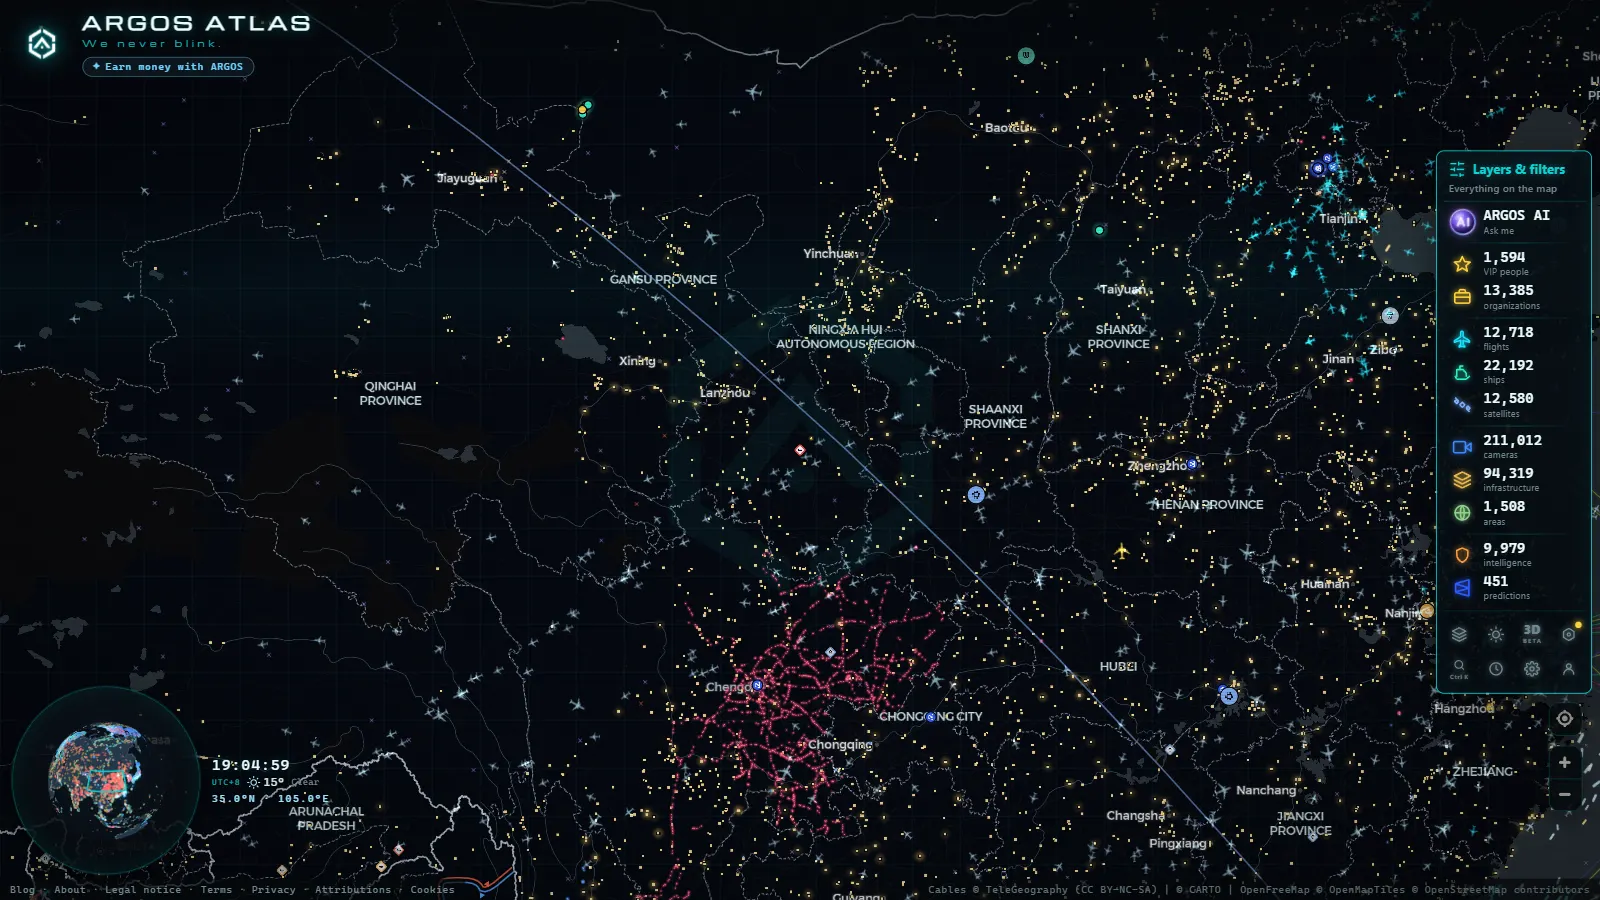
Search "china power plants map" and most of what comes back is a static infographic from a few years ago or a database that wants an email address before it shows you anything. ARGOS Atlas keeps a live, browser-based layer of power infrastructure worldwide, and China is the densest single cluster of markers on it, coal plants, hydro dams, nuclear stations and solar and wind farms packed closer together than in any other country in the catalog.
This is the first article on this blog that zooms the energy layer into a single country instead of looking at the whole planet or a whole region. We've already covered the world's power plants and Latin America's grid; China gets its own piece because the catalog is thickest there, and because the interesting question isn't just "where" but "what kind, and why there." Below is what the map actually shows, what it can't tell you, and how to read it without assuming more than the data supports.
What the china power plants map on ARGOS Atlas shows
Open the map, turn on the power layer, and pan over China: you'll see markers styled by plant type (coal, hydro, nuclear, gas, wind, solar) sitting on top of a dark basemap alongside the same live flight and ship tracks that cover the rest of the world. Each marker is a catalogued installation with a name, a type and a location pulled from public infrastructure sources, not a live sensor feed. Zoom in over any province and the pattern becomes obvious almost immediately: plants don't scatter randomly, they follow coalfields, rivers and coastlines.
What makes China worth its own article is scale and mix. Most countries on the map lean on one or two dominant plant types. China's catalog entries span the full range, thermal coal at industrial scale, some of the largest hydroelectric installations anywhere, a fast-growing nuclear fleet, and wind and solar farms spread across provinces most people couldn't place on a map. Seeing all of it on one layer, at once, is different from reading the numbers in a report.
How the catalog breaks down by plant type
We don't have a citable country-level count to publish here, and we'd rather say so than invent one. What we can describe honestly is the shape of the mix, because it's visible just from panning the map:
| Plant type | What dominates it in China | Where it clusters |
|---|---|---|
| Coal | Still the backbone of the thermal fleet | North and northwest, near the coalfields of Shanxi, Shaanxi and Inner Mongolia |
| Hydro | Includes some of the largest dams on the planet | Southwest, strung along the Yangtze and its tributaries |
| Nuclear | A newer, fast-growing fleet | Southeast coast, from Guangdong up through Fujian and Zhejiang |
| Wind | Large-scale onshore farms | Arid west and north, Xinjiang, Gansu, Inner Mongolia |
| Solar | Utility-scale arrays | Same arid belt as wind, plus rooftop clusters near coastal cities |
| Gas | Smaller, more localized | Concentrated near major coastal demand centers |
The pattern in that table isn't unique to China, it's how power generation works almost everywhere: plants go where the fuel is, where the water is, or where the coastline makes cooling and imports easy. China just has all of it at once, at a scale that makes the map genuinely busy.
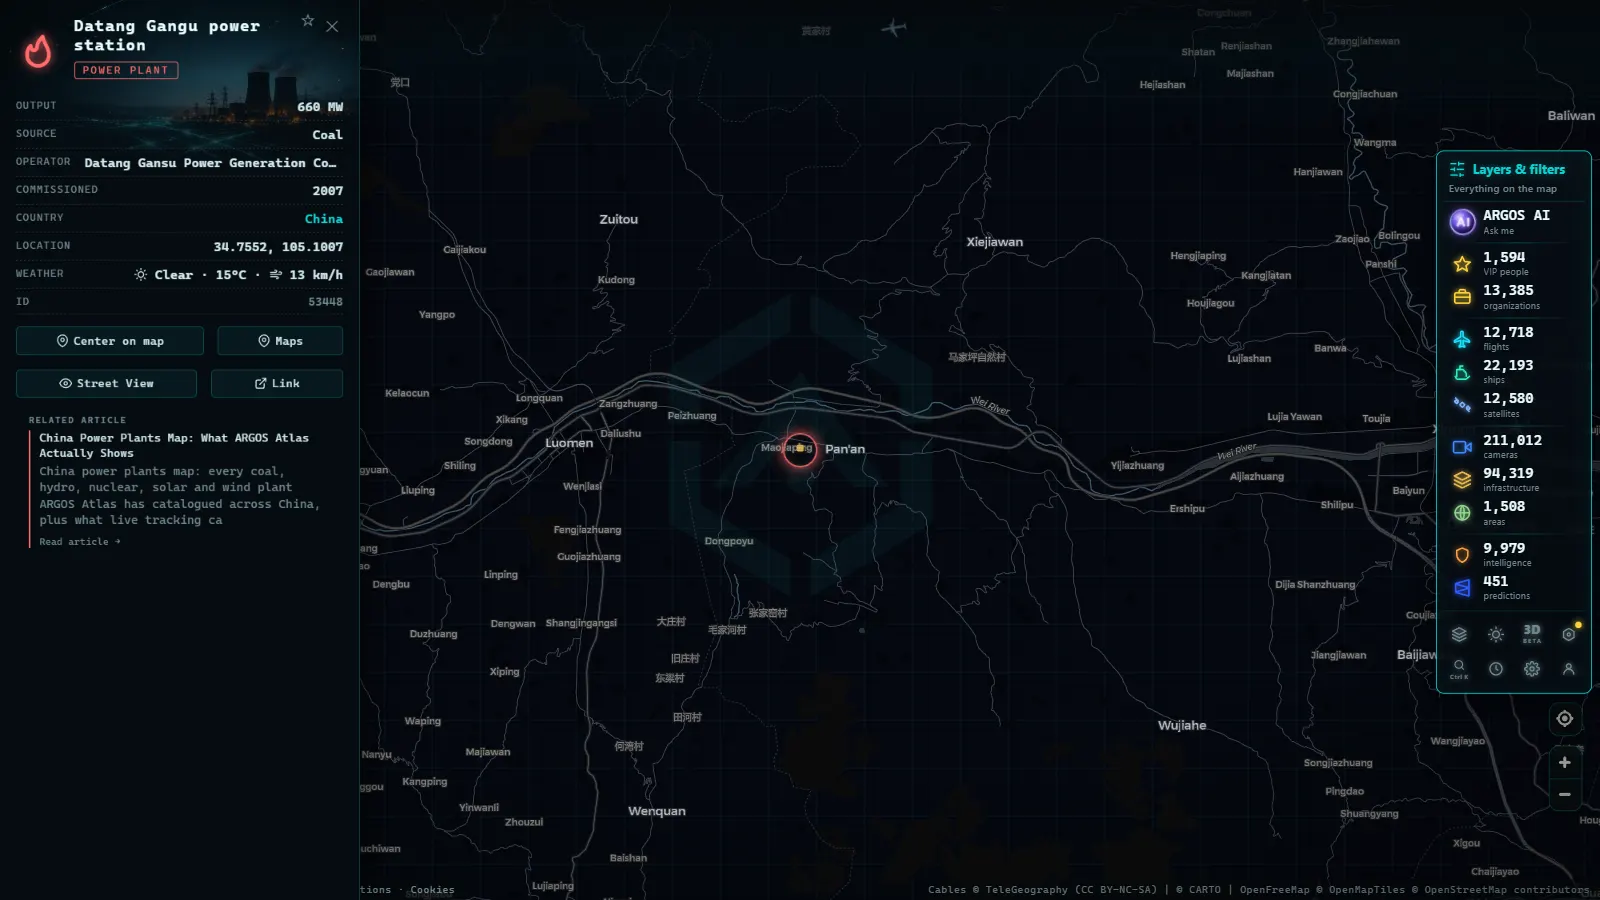
Where China's power plants cluster
Zoom into three regions on the map and the logic becomes visible without reading a single label.
The north and northwest (Shanxi, Shaanxi, Inner Mongolia) is coal country. The plants sit close to the mines that feed them, and the marker density there rivals anything else on the global energy layer, including the coal belts of the American Midwest or northern India.
The southwest tells a different story. Follow the Yangtze River southwest from Shanghai and the map fills with hydro markers, including some of the largest dam complexes anywhere in the catalog. This is the same river system that makes the region look, on a satellite image, like it's been terraced by generations of engineering.
The southeast coast is where nuclear concentrates (Guangdong, Fujian, Zhejiang) close to the demand centers of the Pearl River Delta and the Yangtze River Delta, and close to the coastline that cooling systems need. Nuclear elsewhere in the country is comparatively rare on the map; it's a coastal story almost everywhere you look. Our nuclear power explainer covers why that coastal pattern repeats in most countries with a nuclear fleet, not just China.
China's power plants map vs the world
Across the whole ARGOS Atlas catalog there are 34,936 power facilities logged worldwide (count as of August 2026), spanning every continent except Antarctica. China isn't the only country with a serious energy footprint on the map (the United States, India and the countries of Western Europe all have dense clusters of their own) but pan across the full planet layer and China stands out as the tightest concentration of markers in one contiguous area. If you want the global picture that this article zooms in from, the world's power plants map is the place to start; if you want to understand what separates a coal plant from a combined-cycle gas plant from a run-of-river dam before you start clicking markers, our plant-types explainer covers the basics without China-specific detail.
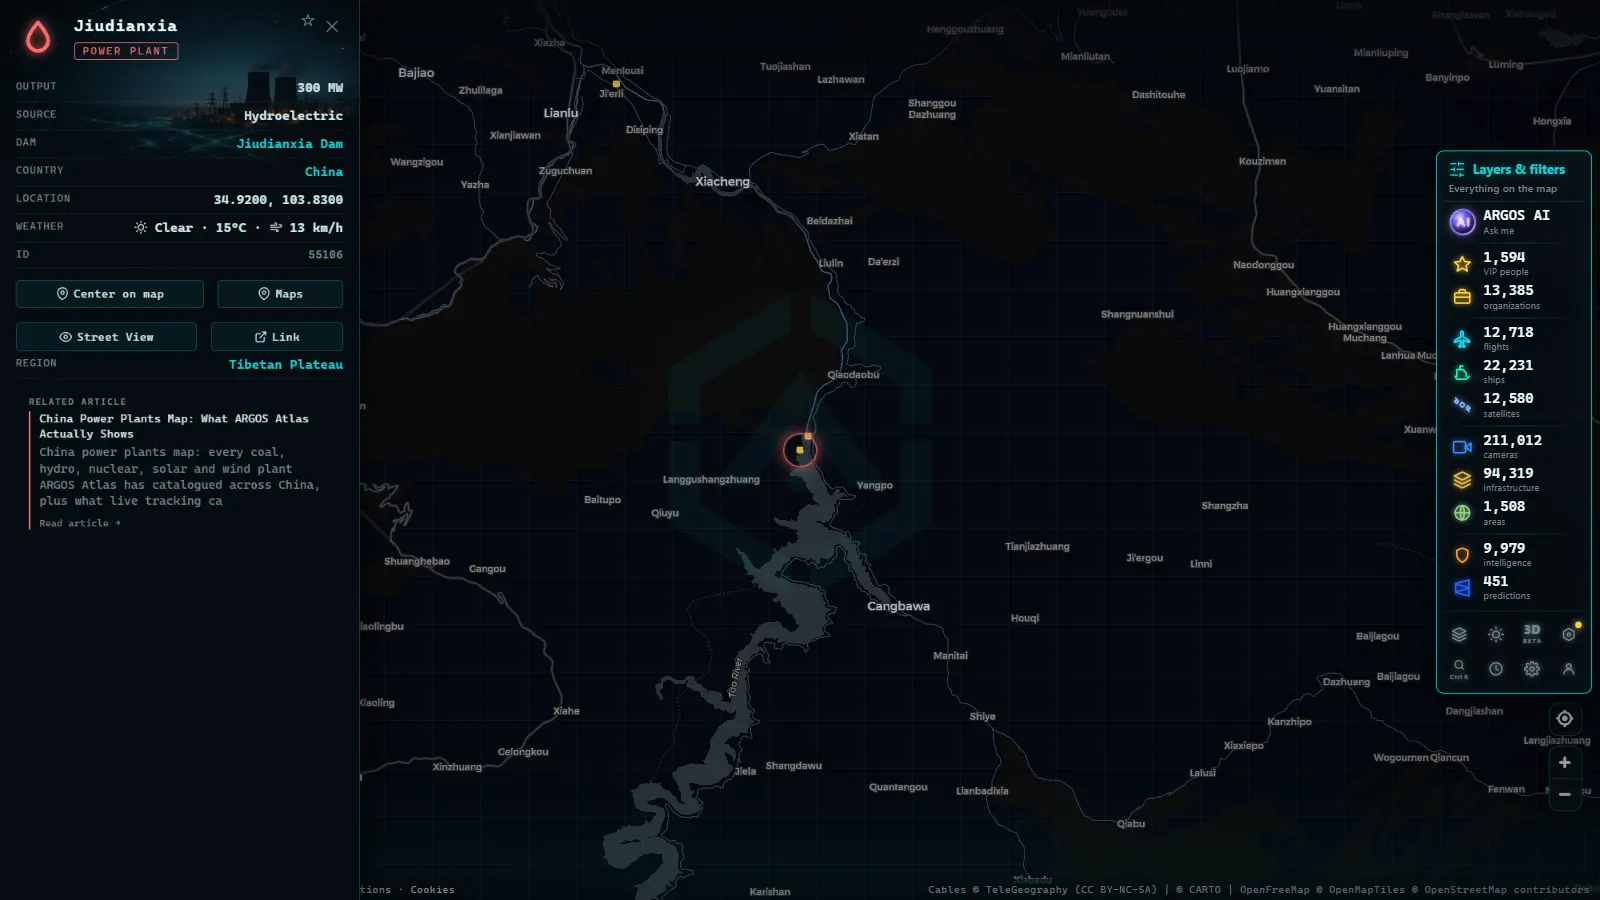
What the map doesn't show
This is the part that matters more than the pretty layer. The catalog registers installations, where a plant is and what kind it is. It does not register:
- Real-time output. A marker on the map doesn't tell you whether that plant is running at full capacity, idling, or offline for maintenance today. China doesn't publish plant-level generation the way some grid operators do, so there's no live number to show even if we wanted one.
- Operational status. Some catalogued plants may be under construction, decommissioned, or mothballed. The map plots location and type, not lifecycle stage.
- Ownership or grid connections. You won't see which utility runs a plant or which transmission lines carry its output to consumers.
- A country-level total we're willing to cite. As above, we'd rather leave a number out than guess one that looks precise and isn't.
This honesty isn't a disclaimer we bolted on afterward, it's the whole point of the site. A dot on a map is easy to mistake for certainty, and infrastructure data ages faster than most people expect. If you're used to real-time layers like flights or ships on ARGOS Atlas, the power layer is a reminder that not every kind of infrastructure can be tracked live, and pretending otherwise would be worse than just saying so.
How to use the china power plants map on ARGOS Atlas
Start at the map and switch on the energy layer from the sidebar. Pan to China and zoom into a province rather than trying to take in the whole country at once, the marker density rewards zooming in. Click any plant for its name and type, and use the layer toggle to isolate just nuclear or just hydro if you want to see one type's geography in isolation from the rest. If you're coming from the regional angle instead of the country angle, the Latin America energy piece shows how differently a smaller, less industrialized grid maps out by comparison, useful context for why China's layer looks as dense as it does.
The map won't tell you how much power any of these plants produced today. What it will show you, better than a report or a table ever could, is the geography behind China's energy system: coal near the mines, hydro on the rivers, nuclear on the coast, and wind and solar spreading across the west, a shape that took decades of infrastructure decisions to produce, laid out on one screen.
Frequently asked questions
Is the China power plants map free to use?
Yes. ARGOS Atlas runs in the browser with no account, no paywall and no download. Open the map, turn on the energy layer, and pan to China.
How many power plants does ARGOS Atlas show in China?
We don't publish a country-level count, because it moves as sources get re-checked. What we can say is that China is the single densest cluster of power-plant markers in the whole catalog, denser than any other country we've mapped so far.
Does the map show real-time electricity production in China?
No. The energy layer plots where installations are, not how much power they're generating right now or whether they're online. China doesn't publish plant-level live output the way it publishes flight or ship positions, so this layer is a location catalog, not a production feed.
What types of power plants are on the China power plants map?
Coal, hydro, nuclear, gas, wind and solar all appear, styled by type so you can tell a coastal nuclear station from an inland coal plant at a glance.
Where are most of China's power plants located?
Coal clusters in the north and northwest near the coalfields, hydro follows the Yangtze and its tributaries through the southwest, nuclear hugs the southeast coast, and wind and solar spread across the arid west. It's a geography built around where the fuel or the resource is, not around where the demand is.
- Russia Power Plants Map: 545 Sites, Live Grid View
- Power Plants in the United States: What the Map Actually Shows
- Power plants in Italy map: 4 plants in a 34,936-site layer
- Power Plants in Turkey Map: Dams, Coal, Gas and Nuclear Sites
- Poland Power Plants Live Map: 4 EC Plants That Heat Cities
- World map of dams and reservoirs: 5,356 points you can open