Blog · Energy & grids
World Power Plant Map: See Every Major Plant Live
Energy statistics are read; energy maps are understood. You can know by heart what share of electricity each technology produces in your country and still miss the most basic fact: where all of it physically sits. A world power plant map turns columns of figures into geography, and suddenly your electricity bill, regional energy dependence, and the latest geopolitical headline make visual sense. This article examines what patterns the global energy map reveals, where its data comes from, what honest limits it has, and how to explore it yourself.
Why Look at Energy on a Map
Energy is a profoundly geographic subject that we usually discuss in the abstract. Three examples of what changes when you look at it on a map:
Your electricity bill. The power you consume is generated in specific places and travels along specific lines. Seeing where the plants feeding your region are -- and how far away -- makes something tangible that on a statement is just a number.
Dependency. The phrase "energy dependence" stays a headline until you see, on the map, that a region's generation is concentrated in a handful of installations of a single type, or that an entire country hangs on fuel arriving through just a few ports.
Geopolitics. International energy tensions -- pipelines, maritime routes, raw materials -- are, at their core, disputes over points and lines on a map. Whoever carries the map in their head reads the news with greater depth.
An energy map answers in seconds the question that statistics dodge: where, physically, does the electricity you are using right now come from?
The Patterns That Jump Out
Open any global electricity generation map and, before reading a single label, the patterns assert themselves.
Plants beside water. Large thermal and nuclear stations line up along rivers, reservoirs, and coastlines. This is not aesthetics: they require enormous volumes of water for cooling, so hydrology literally draws the map of thermal generation. It is one of the siting criteria explored in our article on types of power plants.
The footprint of coal basins. Historic coal regions retain clusters of thermal plants built at the pit head, when transporting coal was cheaper than transporting electricity. Even where many have closed or are closing -- in Appalachia, in the German Ruhr, in the UK Midlands -- their trace remains visible. The energy map has industrial memory.
Wind along its corridors. Wind farms do not spread evenly across the landscape. They line up along ridges, mountain passes, exposed plateaus, and, increasingly, on offshore platforms facing windy coasts -- the North Sea, the US Atlantic seaboard, the waters off Taiwan. Seen from above, the wind map is a map of prevailing winds drawn with turbines.
Solar at its latitudes. Solar plants concentrate in the belts of highest irradiance: the US Southwest, the Middle East and North Africa, southern Europe, the high plains of Chile and Australia. Where there is sun and cheap land, arrays of panels multiply.
Nuclear plants near abundant water. The world's nuclear fleet clusters beside large rivers, reservoirs, and coastlines, and is concentrated in a relatively small group of countries -- the United States, France, China, Russia -- a distribution that deserves a dedicated chapter in our article on nuclear power plants around the world.
Five patterns, one lesson: physical geography commands. Technology chooses its site according to the resource -- water, wind, sun, fuel -- and according to the demand and grid infrastructure nearby.
Where the Data Comes From
A world power plant map is not built by any single organisation working alone. It is assembled by combining open data sources, each with its own origin and character.
The first major quarry is OpenStreetMap, the collaborative free-mapping project whose volunteers have spent years mapping plants, substations, and transmission lines across the planet under an open licence (ODbL). Its coverage is remarkable in many areas, though uneven: it depends on where there is an active community contributing edits.
The second is public registries from grid operators and energy regulators. Bodies that manage or oversee electricity systems -- in the US, entities like FERC and regional ISOs; in Europe, ENTSO-E; national regulators worldwide -- publish inventories of installations, capacities, and technologies, with varying levels of detail by country.
The third is international open-data initiatives for the energy sector: tracking projects that collect, harmonise, and publish global power plant databases by technology type, combining official sources, satellite imagery, and research. These are the sources that allow meaningful cross-country comparisons under consistent criteria. The Global Power Plant Database, maintained by the World Resources Institute, covers tens of thousands of facilities across more than 160 countries with standardised fields.
The maps you consult blend these layers. Knowing the recipe matters: it tells you what reliability to expect and why two maps may disagree on details.
Recorded straight off the map, no sound.
What an Energy Map Reveals
Beyond siting patterns, a good world energy map lets you read three deeper stories.
Concentration. The map shows how much generation is packed into a few points. Some regions depend on electricity from just two or three large installations; others distribute generation across hundreds of medium-sized plants. The difference is not cosmetic: it defines how much damage a single failing node can do.
Vulnerability. Concentration implies risk. Systems heavily reliant on few plants, a single fuel type, or limited interconnection handle shocks -- equipment failures, droughts, cold snaps, heat waves -- far less gracefully. The map does not predict incidents, but it does show where the system has least margin, a reading that connects directly with why blackouts happen.
Transition. Comparing the map of today with that of a decade ago -- or simply noting what is being built and what is being retired -- shows the energy transition in motion: where solar and wind farms are growing, where coal plants are going dark, where pumped storage and batteries are gaining ground. In the US Midwest, the retirement of coal capacity across Appalachia appears as a shrinking cluster of thermal sites; along the North Sea coast, a new constellation of offshore wind platforms has emerged. It is a generational shift told in dots on a map.
Honest Limits: What the Map Does Not Show
No energy map is the complete picture, and that is worth saying plainly.
First, small installations and distributed generation are under-represented. Residential and commercial rooftop solar, mini-plants, and off-grid generators add up to an increasingly significant capacity that large-plant maps barely capture. The map shows the backbone of the system, not all its capillaries.
Second, data freshness varies enormously by country. Where agencies publish rich data and the mapping community is active, the map stays current; where they do not, there are delays, gaps, and outdated figures. A newly commissioned plant may take time to appear; a decommissioned one may linger on the map long after closure.
Third, the map shows where power can be generated, not what is being generated right now. A plant layer is a snapshot of installed capacity, not a real-time production meter. Understanding that distinction -- the same one that separates capacity from energy -- prevents hasty conclusions.
None of this diminishes the value of the tool. It simply gives it the context every good source deserves.
How to Explore It in Argos Atlas
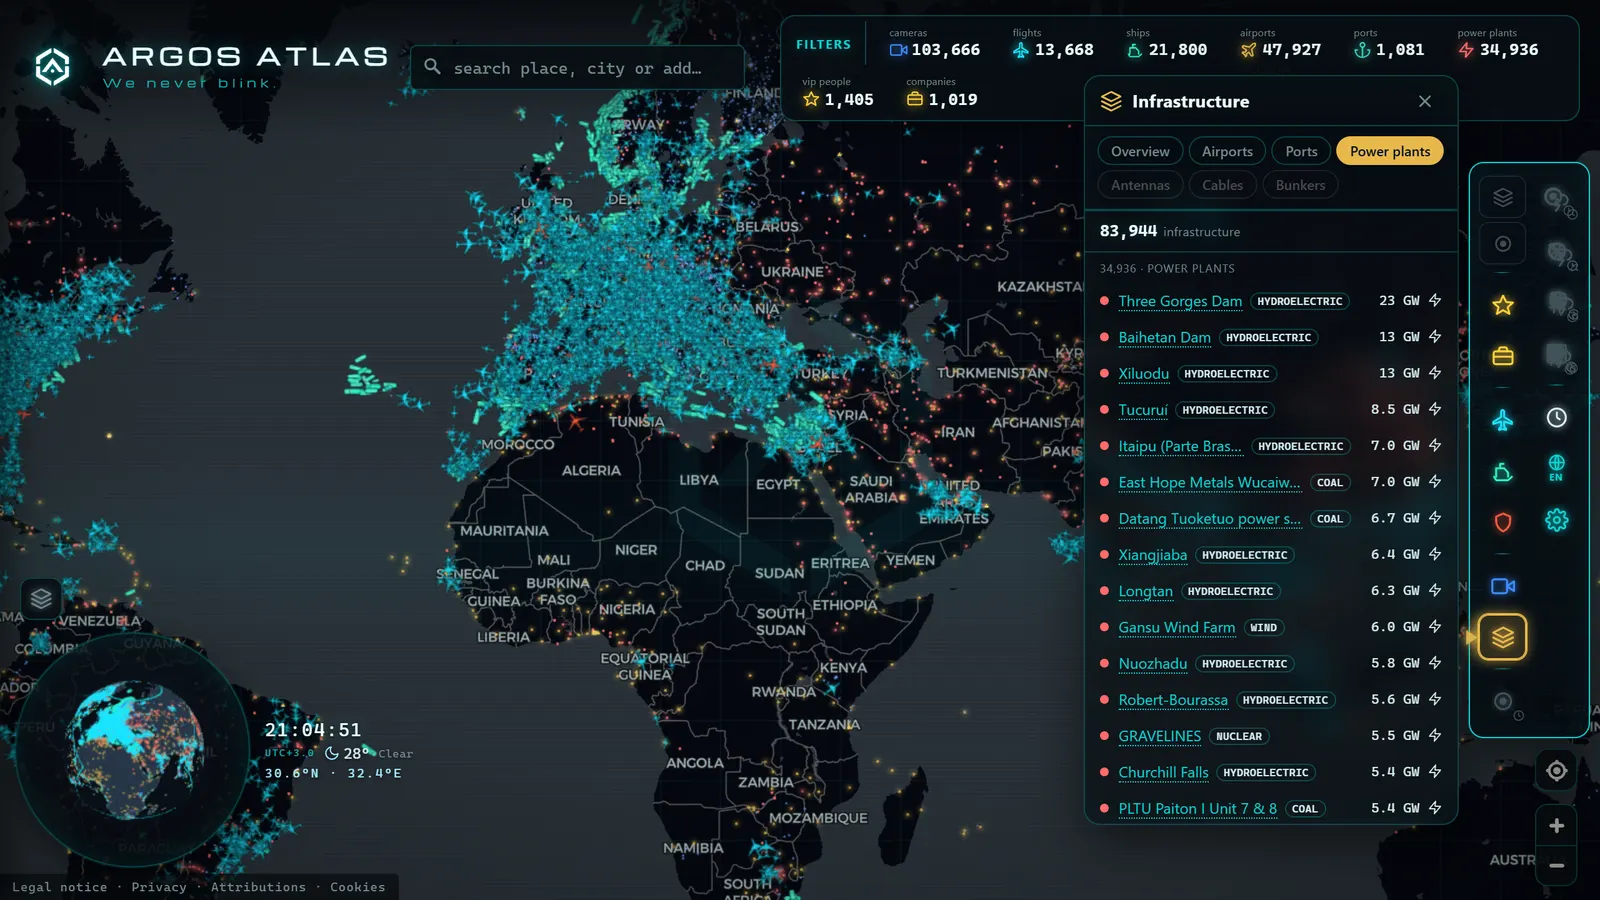
In Argos Atlas, energy is one of the infrastructure layers of the world map. You can activate the global power plant layer and explore every installation in its geographic context, with world rankings of the largest plants by capacity so you can jump straight to the giants. Because the layer coexists in the same viewer as ports and airports, you can read energy infrastructure in context: the plant alongside the port through which its fuel arrives, the logistics node that surrounds it.
Two gestures multiply the experience. Satellite mode lets you see the actual installation -- cooling towers, reservoir surface, the grid of solar panels -- and the global search takes you in seconds to any region on the planet. Everything is free and requires no registration.
An Exercise to Start: Your Region Against the World
Here is a ten-minute exercise worth more than an entire lecture.
First, centre the map on your region and locate its plants: how many are there, what types do they appear to be, beside which rivers or coastlines do they sit? Ask yourself what your area depends on: a single large plant? A distributed mix?
Then jump to another region of the world that interests you -- an Asian industrial basin, a Nordic country running almost entirely on hydro and wind, a desert filled with solar farms, the US Great Plains with its wind corridor -- and repeat the reading. Compare densities, technologies, and locations.
That comparison, made with your own eyes, fixes the key ideas more firmly than any statistic: that energy is geography, that each territory plays with the physical cards it holds, and that the transition is advancing at very different speeds depending on where you look.
Frequently Asked Questions
Does a map of all the world's power plants exist?
Maps exist that cover tens of thousands of plants of every type, built on open data, and they cover the planet's large installations reasonably well. "All of them" in a literal sense, no: small plants and distributed generation escape any global inventory. Argos Atlas includes a world power plant layer with ranked lists of the largest by capacity, integrated with the rest of the infrastructure layers.
Where does the data come from?
From a combination of open sources: the OpenStreetMap community, which maps energy installations under a free licence; public registries from grid operators and national regulators; and international open-data initiatives for the energy sector, which collect and harmonise global databases. Each source has its own coverage and update cycle, and the maps integrate all of them.
Are all power plants included?
No. Large plants are well covered, but small installations, rooftop solar, and very recent projects appear with a delay or not at all, and data quality varies with what each country publishes. This is the honest limit of any energy map: it shows the backbone of the system, not all its capillaries.
What is the point of viewing energy on a map?
To understand at a glance what statistics cannot convey: where generation is concentrated, what each region depends on, where the system has vulnerabilities, and how the transition is progressing -- where renewables are growing and where thermal plants are shutting down. Also to read the news more sharply: much of energy geopolitics consists of points and lines on a map.
Conclusion
The world energy map is one of those tools that permanently changes how you see things. Once you have watched thermal plants follow rivers, wind turbines line mountain ridges, and solar arrays fill desert plateaus, you can no longer think of electricity as something abstract. It is geography, with its patterns, its open data, and its honest limits.
The invitation is straightforward: open the map in Argos Atlas, activate the power plant layer, and run the exercise of comparing your region with another part of the world. Ten minutes of exploration, and the next energy headline you read will have a landscape behind it.
Frequently asked questions
Does a map of all the world's power plants exist?
Maps exist that cover tens of thousands of plants of every type, built from open data. None is literally complete -- small installations and distributed generation are under-represented -- but the world's major plants are reasonably well mapped. Argos Atlas includes a global power plant layer with ranked lists by capacity.
Where does the data for these maps come from?
From open sources: the OpenStreetMap community, public registries from grid operators and energy regulators, and international open-data initiatives that collect and harmonise sector information. Each source has its own coverage and update cadence, and maps combine them.
Are all power plants included?
No, and that is worth knowing. Large installations are well covered, but small plants, rooftop solar, and very recent projects appear with a delay or not at all. Data quality also varies by country depending on what regulators publish.
What is the point of viewing energy on a map?
To grasp at a glance what statistics cannot convey: where generation is concentrated, what each region depends on, how the energy transition is progressing, and where systemic vulnerabilities lie. Geography explains much of your electricity bill and most of energy geopolitics.
Can I explore the map for free?
Yes. Argos Atlas is free and requires no registration. Activate the power plant layer, switch to satellite view to see real installations, and use the global search to jump to any region in seconds.
- How Long Do Power Outages Last in Puerto Rico? Causes & Management
- China Power Plants Map: What ARGOS Atlas Actually Shows
- Russia Power Plants Map: 545 Sites, Live Grid View
- Power Plants in the United States: What the Map Actually Shows
- Power plants in Italy map: 4 plants in a 34,936-site layer
- Power Plants in Turkey Map: Dams, Coal, Gas and Nuclear Sites