Blog · Energy & grids
World map of dams and reservoirs: 5,356 points you can open
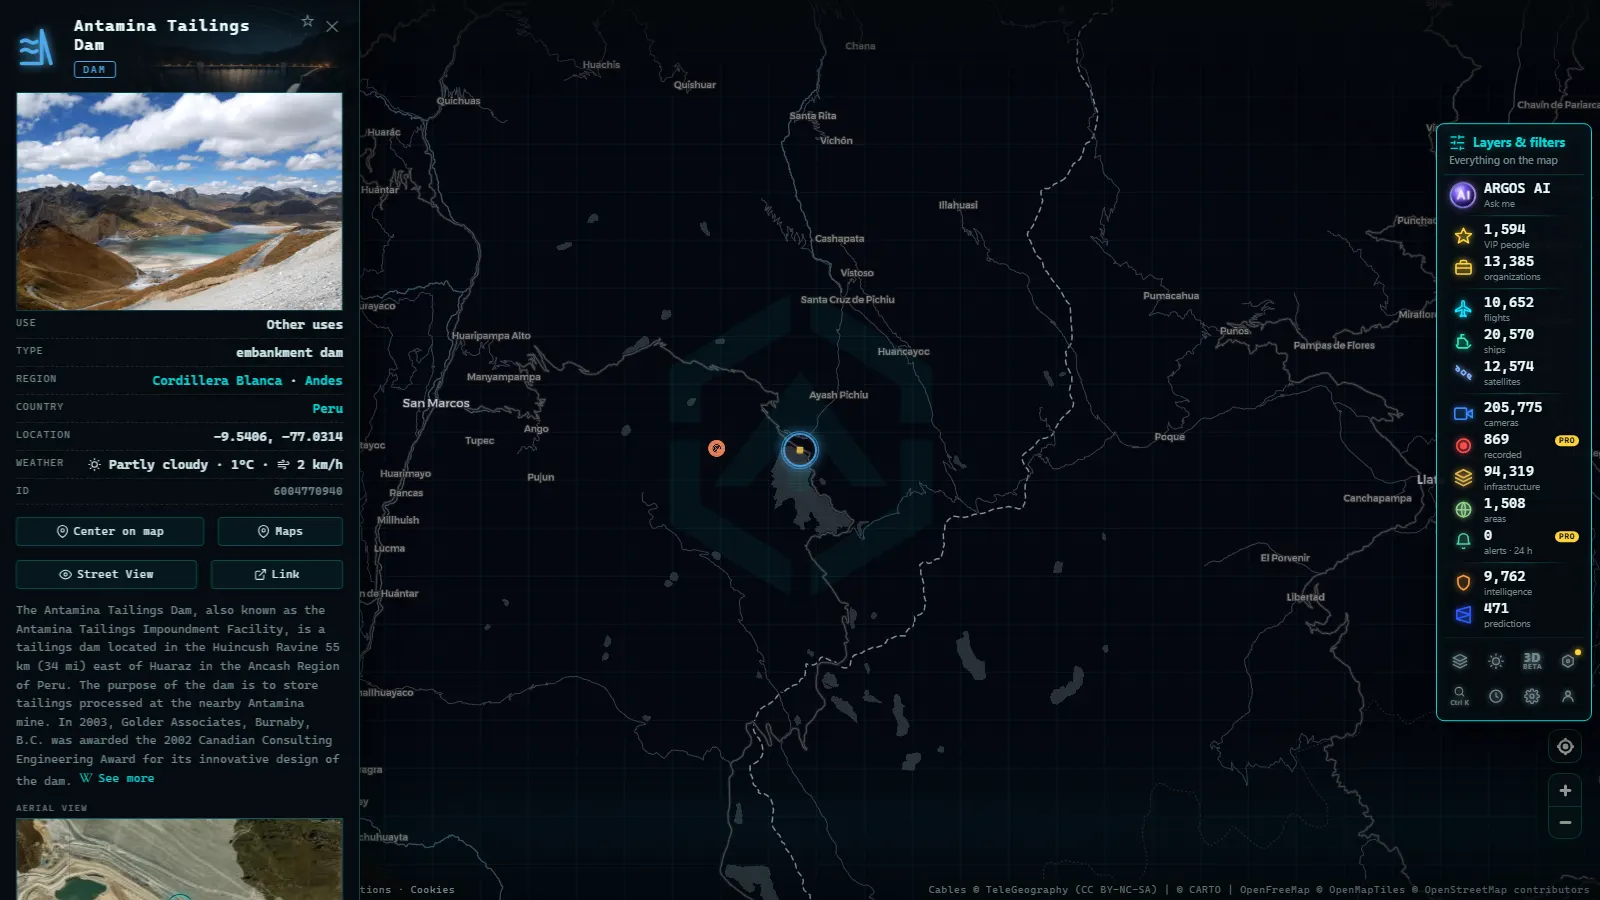
The dams layer of ARGOS ATLAS plots 5,356 dams and reservoirs worldwide (count as of October 2026), free and with no sign-up. Click any point and you get four things: position, name, structural type and declared use. It is an inventory, not a ranking of the tallest, and that difference is the whole point of this page.
Most results for a world map of dams and reservoirs are the same ten superlatives copied between sites. This one lists what we actually hold, including where it is thin: hydroelectric walls, irrigation reservoirs and mining tailings dams in one layer, unevenly spread, with no height, no volume and no flow, because those fields are not in our data.
The essentials, in 20 seconds
- 5,356 dams and reservoirs in the layer (count as of October 2026), each with a stable id you can link to.
- Three families carry the inventory: hydroelectric, irrigation and water supply, and mining tailings.
- Dam type and use are copied from the source record (for example embankment dam, use other), with the Wikidata id kept so you can audit a point.
- No height, volume or flow: position, name, type and use is the entire record.
- 34,936 power plants and 1,081 ports sit on the same map, so a dam reads next to the grid it feeds.
What a world map of dams and reservoirs actually holds
A dam point is four fields and nothing more. The structural type is the engineering family: an embankment dam is compacted earth and rock, a gravity dam holds by sheer mass, an arch dam pushes the load into the canyon walls. The declared use is what the source says the water is for, and often it is just other, which is useful rather than empty: it tells you nobody classified it.
That is a thinner record than a national dam register, and it is the price of being global instead of one country deep. Every point keeps the Wikidata id it came from, so a claim here can be checked rather than believed. When an id is missing the point still shows, and the panel says so instead of filling the hole with a plausible number.
Hydroelectric dams, described by two layers at once
Hydro is the subset two layers cover together. The dam point gives the wall and the reservoir; the power layer gives the station that turns the drop into electricity, usually a few hundred metres away on screen. If you are tracing where a country's power comes from, open both: the live world energy map with located power plants holds 34,936 plants, and the dams layer explains why so many sit in mountain valleys.
The pairing also shows the limit. A dam point carries no installed capacity and a station point carries no head of water, so output cannot be computed from this map. What you can read is geography: a chain of reservoirs down one river, the distance from wall to switchyard, how close the arrangement sits to a border. For the engineering behind it, the guide to types of power plants is the companion.
Irrigation and water supply reservoirs
Irrigation reservoirs are the quiet majority of dam building, and they behave differently on screen: farmland instead of canyons, wide instead of deep, and often seasonal. The basin that is a lake in March can be cracked mud in September. The layer does not follow that cycle, it only says a dam is there.
City water supply reservoirs are the other half of the family, and the ones that make the news in a drought. The honest framing is that this is a locator, not a gauge: you see that the reservoir exists and where it sits relative to the city, never the level, the percentage full or the inflow. National water agencies publish those, and we do not restate them. What the map adds is the spatial argument: how far the water travels and what it crosses on the way.
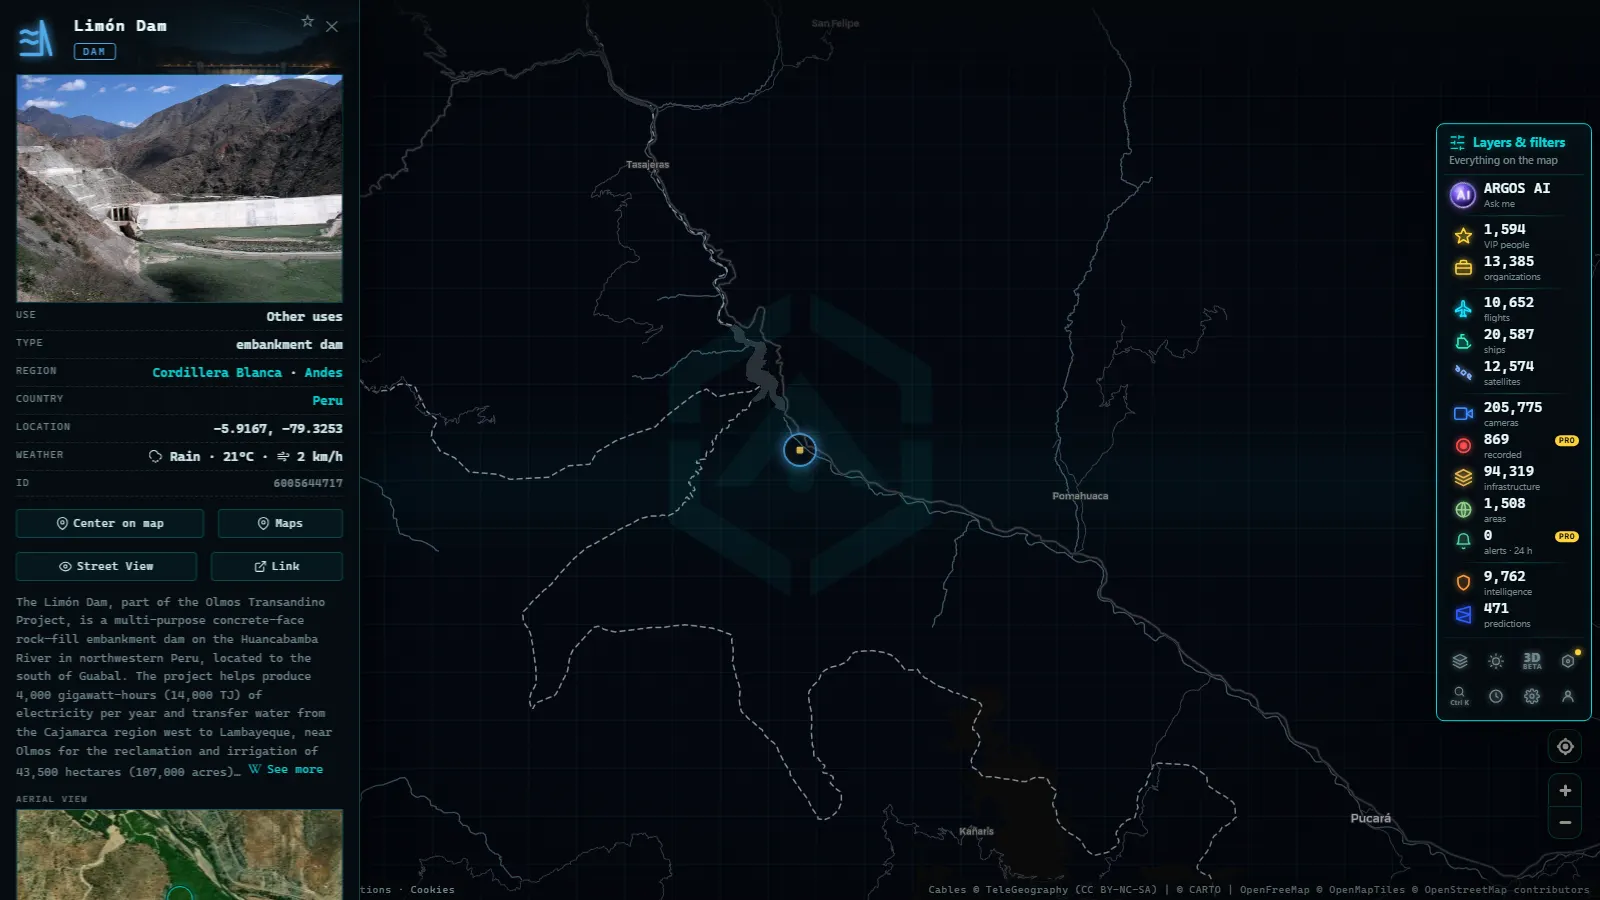
Tailings dams, the category most maps skip
Mining tailings dams are missing from most world maps of dams because they do not store water: they hold the slurry left after ore is processed, behind a wall that often grows for decades. They also have the worst failure record of the last twenty years, which is why keeping them in the same layer as hydro matters.

That point shows how thin and how useful the record is at once. It is tagged an embankment dam with use other, it sits in the Andes of Áncash, Perú, above one of the country's biggest copper and zinc operations, and it carries a Wikidata id you can verify. It does not carry wall height, stored volume or freeboard, which are exactly the numbers an engineer wants. Four honest fields beat five with one invented.
Where the points cluster, and why density is not coverage
Dams concentrate where water, terrain and money meet: the Andes, the Alps and the Pyrenees, the Iberian plateau, the Rockies and the Columbia basin, the headwaters of the Yangtze and the Mekong, southeastern Türkiye, the Brazilian interior. At continental zoom the pattern is visible before you read a label.
Read that density as a map of what has been catalogued, not of what exists. A country with a mature public register looks dense; a country that publishes nothing looks empty while holding hundreds of structures. The caveat applies to every open data layer and it is the one rankings skip. For the general version of the argument, what critical infrastructure is and why it appears on public maps sets it out.
What each kind of point is good for
| Type in the layer | What it usually is | What the record gives you | What to look for |
|---|---|---|---|
| Hydroelectric dam | A wall and reservoir feeding a station | Position, name, dam type, use | The power plant point beside it, and the river chain upstream |
| Irrigation reservoir | A shallow store for farmland | Position, name, dam type, use | Canal lines on the base map and the fields they serve |
| Water supply reservoir | A city's drinking store | Position, name, dam type, use | Distance to the city and what the pipeline crosses |
| Tailings dam (mining) | Processed mine waste behind a wall | Position, name, dam type, Wikidata id | The pit and plant uphill, and the valley below the wall |
| Use recorded as other | Unclassified by the source | Position, name, dam type | Treat the use as unknown, never as absent |
The last column is why the table is here. A dam point on its own is a dot; read next to the station, the canal or the pit that explains it, it becomes a piece of reporting. The other row is deliberate: an unclassified use is a known unknown, and that is more accurate than guessing irrigation because the valley looks green.
What you can actually watch today
Dams almost never have public cameras. Reservoir operators do not publish live feeds, and the few that exist are seasonal spillway views. So for a dam point the realistic answer is the record plus whatever lives around it.
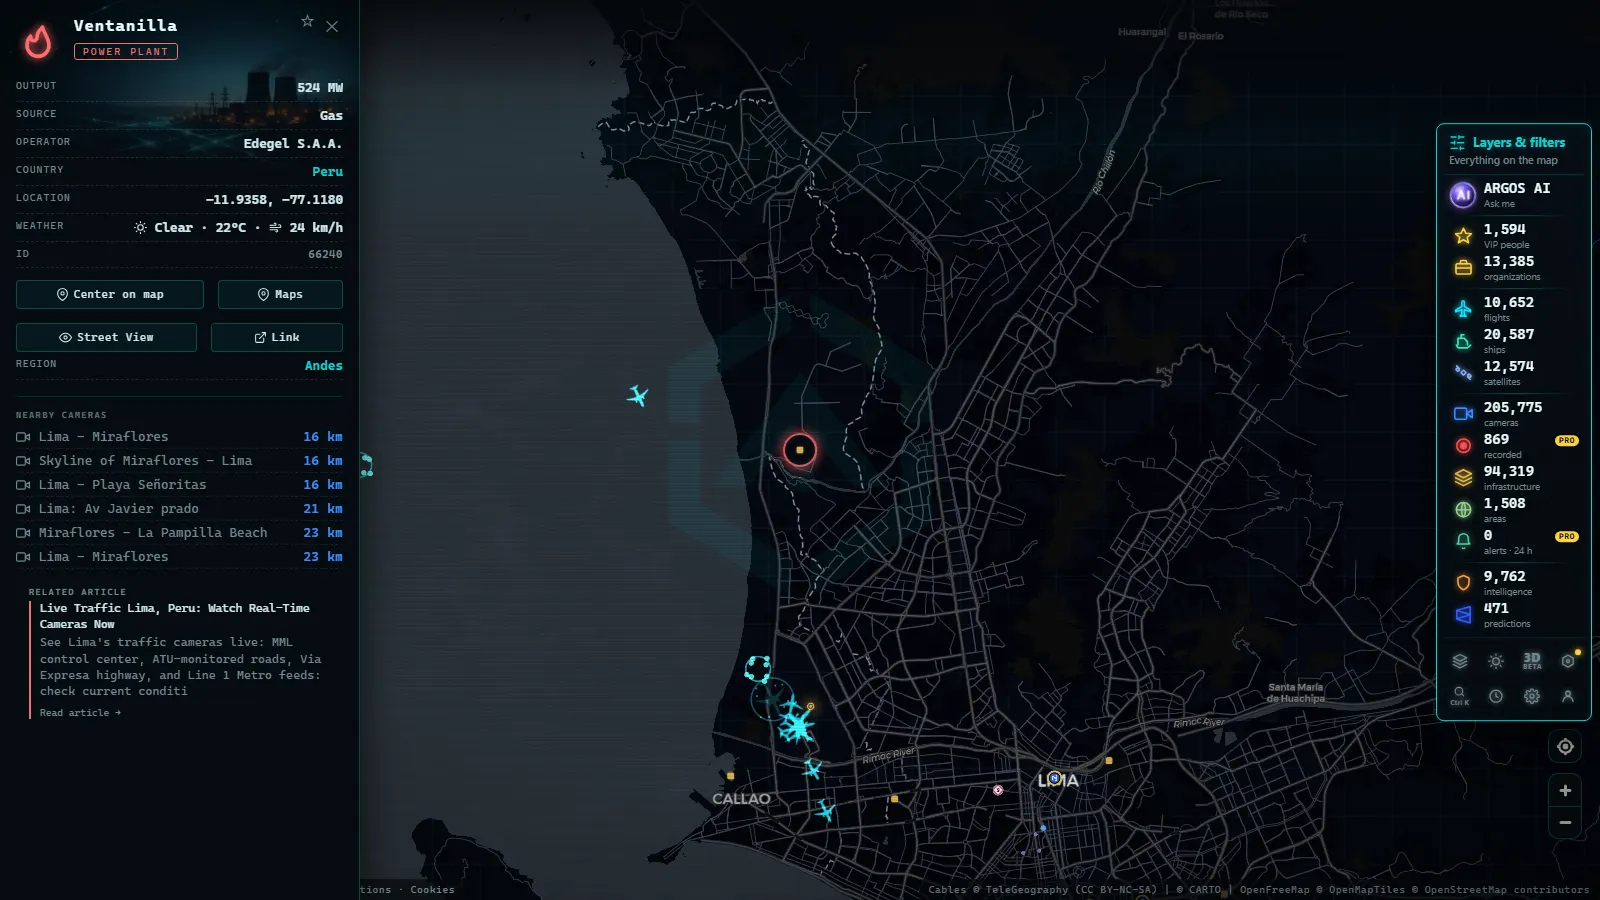
Perú shows the gap well. The closest public camera to the Antamina tailings dam is a coastal view at Tortugas, near Casma, in the same region of Áncash but hours down the valley. It reports the weather on the coast, not the state of the wall. That is the real distance between what a camera shows and what you want to know.
The points cited
200 km
The camera is still worth opening, for a different reason: it is one of 205,772 cameras on the map (count as of October 2026), and the reflex that works there (check the frame, check the time, cross it against another layer) is the one that makes the dams layer useful.
What you won't see
- No live video of a dam. The dams layer has no camera feed and we do not imply one. The cameras on the map are traffic and coastal views, served as still frames that refresh, not as streamed video.
- No height, volume, capacity or flow. Those fields are absent from our records, so there is no sorting by biggest and no ranking of any kind.
- No reservoir level. Drought percentages come from national water agencies and satellite analysis, not from this layer.
- No faces, no plates. Camera frames are never used to identify people or vehicles, and night frames are often dark, frozen or offline.
- No completeness. Where a country publishes no register the map looks empty, and an empty area is a statement about data, not about the ground.
Using the world map of dams and reservoirs without guessing
Three steps answer most questions. Locate: open the live ARGOS ATLAS map and find the structure by river rather than by name, because names differ between languages and registers. Cross reference: switch the power layer on to see whether a station sits beside the wall, and check what lies downstream. Verify: take the Wikidata id from the panel and confirm the identification in a source that publishes the engineering numbers we do not hold.
In that order you get what a ranking cannot give: the spatial relationship between a structure, the grid it feeds and the towns it stands above. If the grid is what you were really after, why blackouts happen and how the power network is watched continues from here.
Frequently asked questions
Is the world map of dams and reservoirs free to use?
Yes, and with no registration. The dams layer opens with the rest of the map, 5,356 points worldwide (count as of October 2026), with no account, no trial and no paywall on the layer. You click a dam and read its name, structural type, declared use and Wikidata id in the side panel.
How many dams does the map actually show?
5,356 dams and reservoirs, counted in October 2026. The number moves as records are added, so treat it as a snapshot rather than a global total: it reflects what public registers and Wikidata publish, not every structure that exists. Countries without an open register are thin or absent on the layer.
Can I see a dam's height or how full the reservoir is?
No. The layer carries position, name, structural type and declared use, and nothing hydrological: no height, no crest length, no stored volume, no flow and no reservoir level. For fill percentages during a drought, national water agencies and satellite analysis are the sources, and we do not restate their figures here.
Are there live cameras pointing at dams?
Almost never. Reservoir operators rarely publish public feeds, so a dam point comes with its record and not with video. What you can open nearby is ordinary public cameras: the closest one to the Antamina tailings dam is a coastal view at Tortugas, near Casma, hours away in the same Peruvian region.
What is a tailings dam, and why is it on the same layer as hydro?
A tailings dam holds mine waste slurry, not water, behind a wall that is often raised for decades. It sits in the same layer because the question a reader asks is the same one: what is upstream of this valley. Keeping both in one inventory makes that comparison possible instead of splitting it across pages.
- South America Power Plants: Country by Country on the Map
- Norway power plants on the map: hydro, dams and live views
- Why Blackouts Happen and How Power Grids Are Monitored 24/7
- How Long Do Power Outages Last in Puerto Rico? Causes & Management
- China Power Plants Map: What ARGOS Atlas Actually Shows
- Russia Power Plants Map: 545 Sites, Live Grid View