Blog · Energy & grids
South America Power Plants: Country by Country on the Map
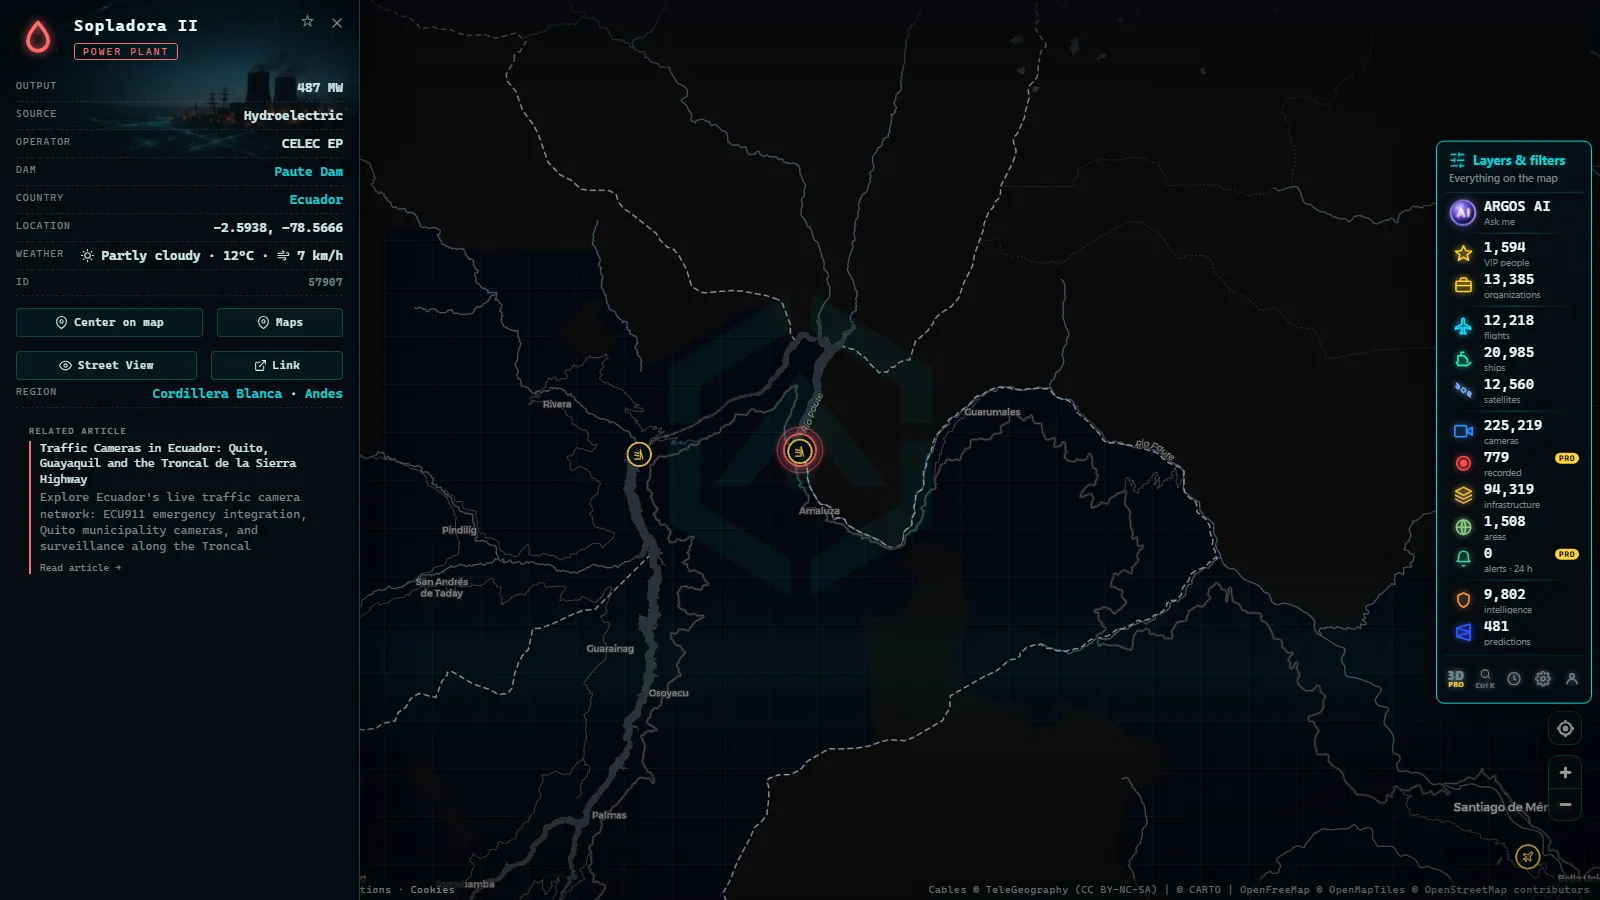
South America's power plants are mapped for free and without an account, inside a global energy layer of 34,936 electrical facilities. In this part of the world the layer thickens in three places: the thermal belt pressed against the port of Buenos Aires, the gas units sitting inside Lima, and the hydro chain that runs down the Andes from Ecuador to Patagonia. Open any one of them and you get a card with fuel, listed capacity and operator, plus whatever public cameras happen to look at that same stretch of coast or road.
What you will not get is a live feed of the turbines. The energy layer is an inventory: fixed points with attributes, not video. The part of the picture that actually moves comes from traffic and beach cameras around the plants, and from the ships queuing at the ports that supply them. Knowing which half is live and which half is static is the difference between reading this map properly and misreading it.
The essentials, in 20 seconds
- 34,936 power facilities worldwide in the energy layer, free, no registration, no account.
- Buenos Aires holds the densest thermal cluster in the region: COSTANERA (coal) and NUEVO PUERTO (gas) share the same waterfront.
- Lima runs on gas inside the city limits: Santa Rosa, operated by Edegel S.A.A.
- Ecuador leans hydro: Mazar sits in the separate dam layer, one of 5,356 dams mapped worldwide.
- Plant cards are static data. The live images come from nearby public cameras, served as still frames.
What the South America power plants layer covers
The energy layer plots generating facilities wherever public datasets place them with usable coordinates. For each point you get the same four fields: type of installation, listed capacity, fuel, and operator when one is recorded. That is a narrow card by design, and it is honest about its limits: no output, no load, no fuel burn today.
Coverage across the continent is uneven, and the unevenness follows the data, not the electricity. Coastal Argentina, Peru and Ecuador come through densely because their big units are documented and geolocated. Interior Bolivia and the Amazon basin thin out fast. Small diesel sets, captive mine generation and anything commissioned recently are the first things missing.
Hydro splits across two layers, which catches people out. The turbine hall is an energy point; the wall holding the reservoir is a dam point. If you only switch on one of them you will think half the Andean system does not exist. The world energy map with located power plants explains how the global version of the same layer is assembled.
South America power plants, country by country
| Country | What the grid leans on | Named on the map | What to look for |
|---|---|---|---|
| Argentina | Gas and coal thermal on the Río de la Plata, hydro in the south | COSTANERA, NUEVO PUERTO | Two heavy units inside the capital, metres from the docks |
| Peru | Gas from the southern fields, hydro in the sierra | Santa Rosa (Edegel S.A.A.) | A gas plant surrounded by a metropolitan area, not by countryside |
| Ecuador | Hydro, with coastal thermal around Guayaquil | Mazar (dam layer) | The reservoir chain, then the port that imports the fuel |
| Brazil | Hydro first, gas and biomass second | Dense hydro along the Paraná and Tocantins | How far the dams sit from the demand they feed |
| Chile | A long thin grid, solar north, hydro south | Scattered coastal thermal | Plants strung along one line, not clustered |
| Colombia | Hydro plus Caribbean thermal | Points near Barranquilla and the Magdalena | Where generation meets the coast |
| Venezuela, Bolivia, Paraguay, Uruguay | Large hydro, thin thermal | Sparse coverage | Treat gaps as missing data, not missing plants |
Argentina: the thermal belt on the Río de la Plata
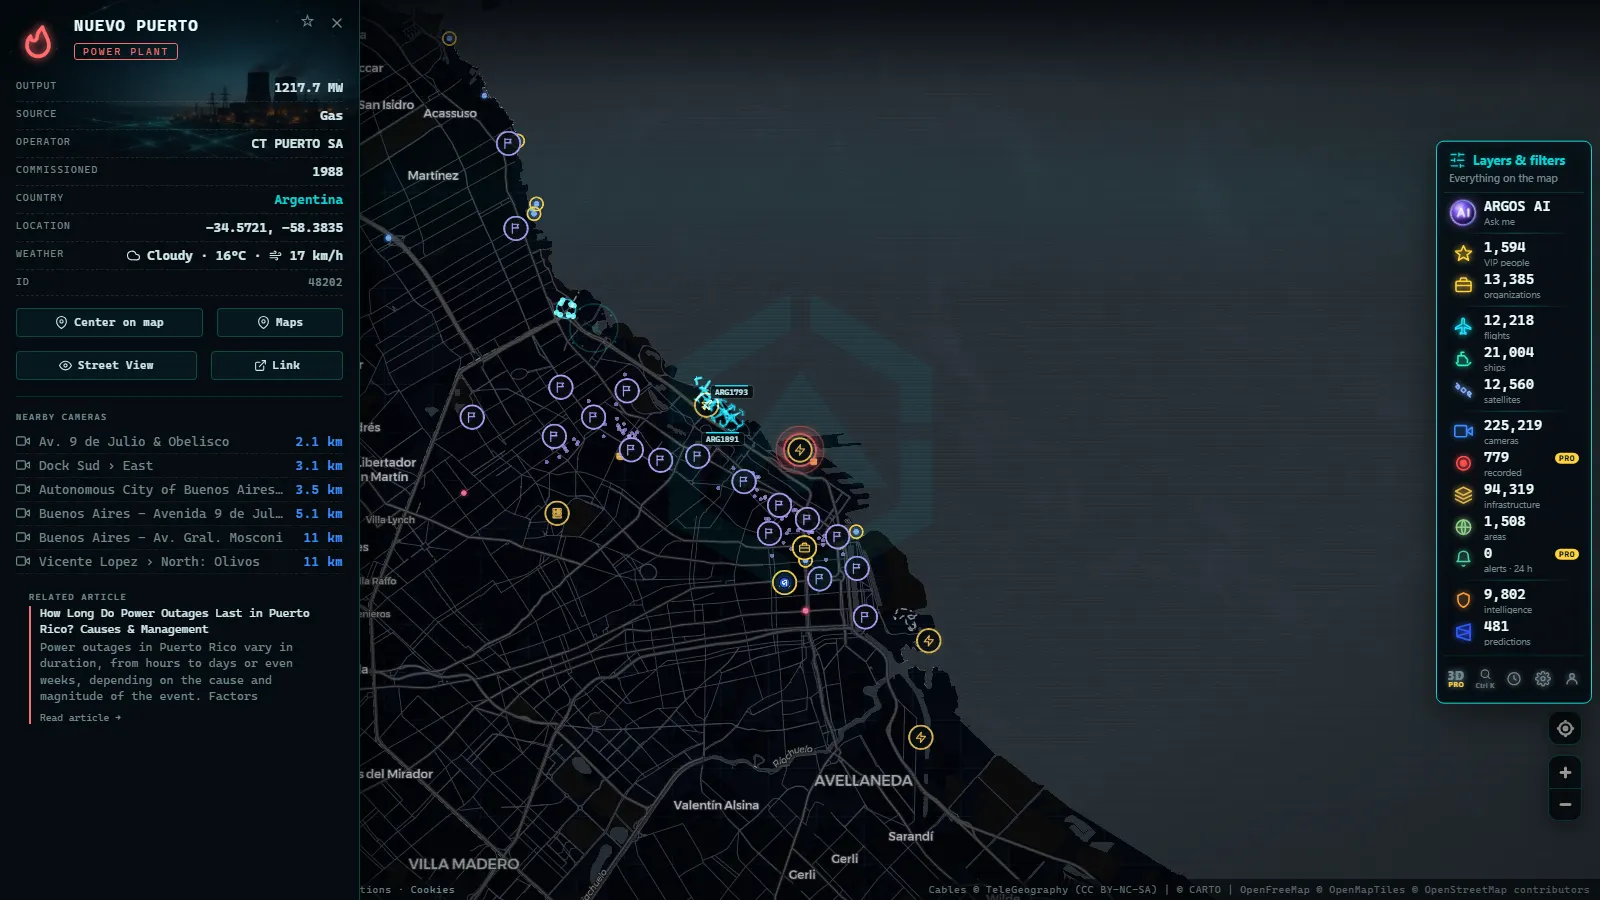
The single most striking thing about Argentina in this layer is how urban its big thermal generation is. COSTANERA, a coal plant operated by ENDESA COSTANERA, and NUEVO PUERTO, a gas plant operated by CT PUERTO SA, sit on the waterfront of the Autonomous City of Buenos Aires, inside the city, next to the container terminals.
That geography is not an accident. Both plants were built where fuel arrives and where the load is, which is also where the webcams are. Open the camera layer over the same frame and you are looking at traffic feeds a few kilometres from a plant listed at close to 2,000 MW on its card.
Further out, the suburban cameras of Gran Buenos Aires cover the roads that carry the maintenance traffic. None of this tells you whether a unit is running. It tells you where the infrastructure physically is, which is the part most maps of Argentina get vague about.
Peru: gas inside the city
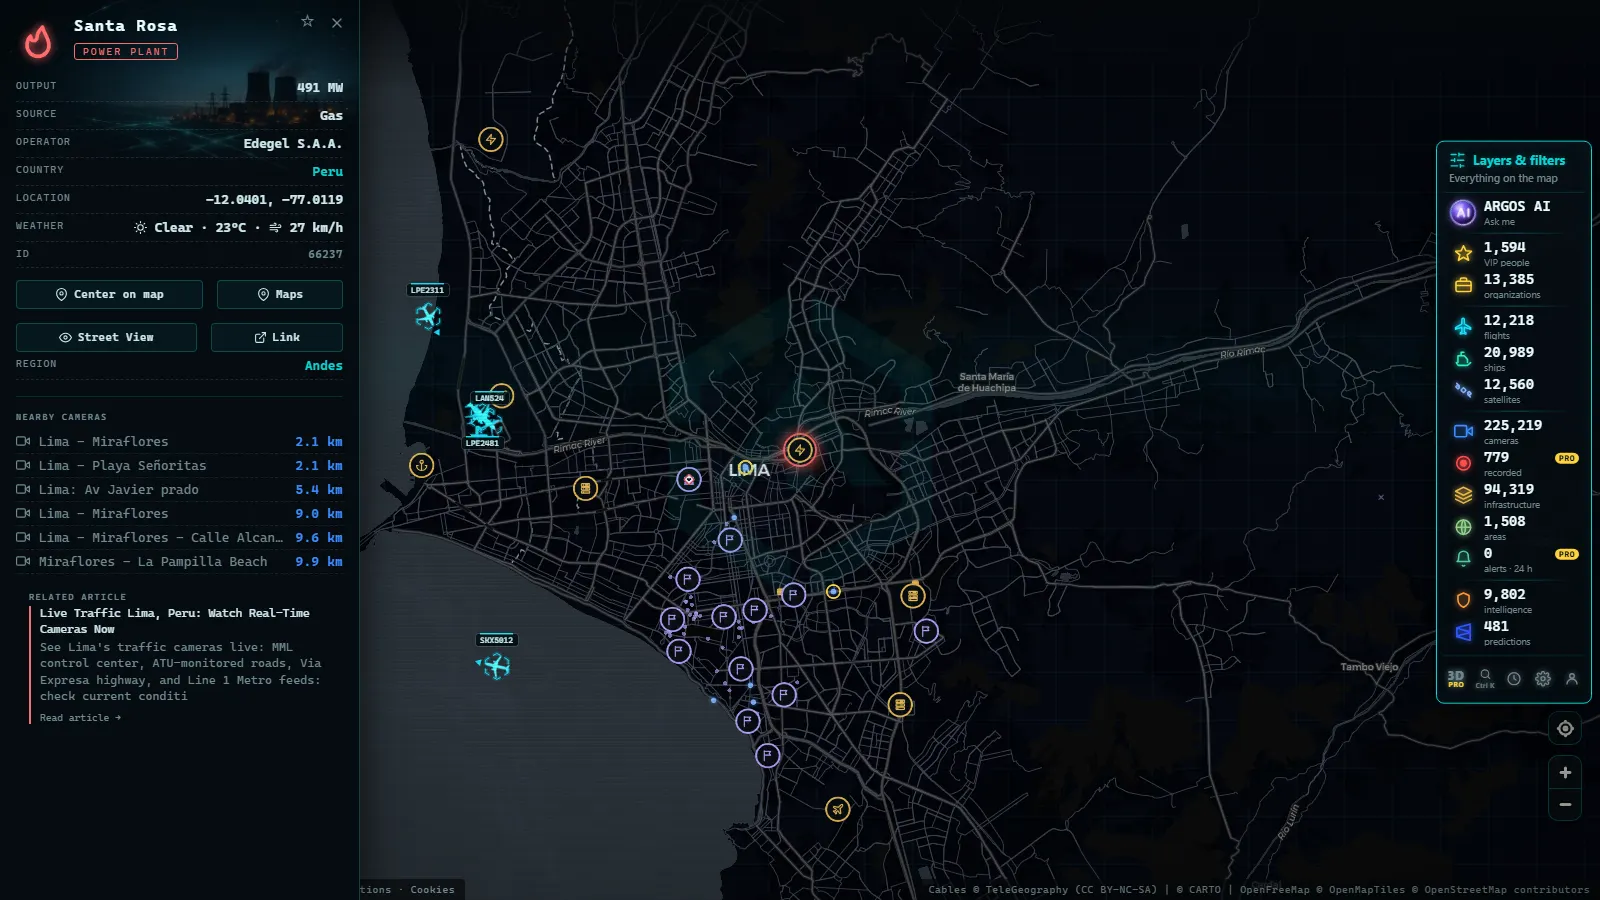
Peru shows the same pattern in a smaller frame. Santa Rosa, operated by Edegel S.A.A., is a gas plant inside the Lima metropolitan area, close enough to the centre that the city has grown around it rather than away from it.
Lima is the clearest case on the continent of generation, port and population stacked on top of each other. The plant is a few kilometres from Callao, the port that handles most of the country's trade, and the coastal cameras in Miraflores and along Playa Señoritas sit on the same shoreline. You cannot see the plant from them, and nobody should claim otherwise, but you can read the weather, the sea state and the traffic in the city the plant feeds.
Inland, the picture thins. Andean hydro and the mine generation of the south are poorly represented, so judge Peru on the coastal strip and treat the sierra as under-mapped.
Ecuador: a grid built on reservoirs
Ecuador is the hydro country of the three. The Mazar installation appears in the dam layer with its use, its length and its listed power, part of a chain on the Paute river that carries much of the national supply.

That concentration is why Ecuadorian supply is seasonal in a way Argentina's is not: when the reservoirs drop, the coastal thermal units around Guayaquil and the port that fuels them become the whole story. The port of Guayaquil is in the ports layer, one of 1,081 mapped worldwide, and the coastal cameras at Montañita and Ayangue Beach in Santa Elena give you the daylight conditions along that shore.
If you want the structures rather than the turbines, the world map of dams and reservoirs covers how those 5,356 points are classified.
Ports, data centres and the rest of the load
Generation only makes sense next to the things that consume and supply it. Three ports anchor the region in this map: Buenos Aires, Callao and Guayaquil. Each is a fuel entry point as well as a trade hub, and each has ship traffic you can watch arriving in real time.
Demand is showing up too. The data centre layer holds 4,072 facilities worldwide, and Lima alone carries several: Centro de Datos Monterrico (operator NextStream) and Centro de Datos Cirion LIM1 among them, with Centro de Datos Win Santa Catalina in the same metropolitan sprawl. They are small points now, but they are the fastest-growing category of load on any grid.
The points named in this article
50 km
Air traffic completes it: the same corridors are covered in the guide to South American airports live.
How to read a South America power plants card
Start with the fuel field, because it tells you the behaviour. A gas plant near a city is usually there to follow demand peaks. A coal unit on a waterfront is there because fuel arrives by ship. A hydro point is a seasonal machine whose output depends on what fell as rain months ago.
Then read the capacity as a nameplate, not as production. COSTANERA being listed near 2,000 MW means that is what it could deliver fully loaded, not what it delivered last night. Confusing the two is the most common mistake made with this kind of data.
Finally, check the operator. It is the field that lets you connect a point on the map to filings, tariffs and news, and it is the one most often missing. For the physics behind each category, the guide to types of power plants and how electricity is generated covers what the fuel field actually implies.
The cameras near the plants, and what they frame
No public camera in this catalogue points at a power plant, and that is normal: traffic and tourism cameras point at roads and beaches. What they give you is context in the same frame, at the same hour.
Use them for conditions, not for the plant: whether the Buenos Aires waterfront is in fog, whether the Ecuadorian coast is under cloud, whether traffic is moving. Combined with the plant cards on the full live map of cameras, flights, ships and power plants, you get the static infrastructure and the moving weather on one screen, which is the only honest version of real time this layer offers.
What you won't see
- No live video of any plant. The cameras are public traffic and coastal feeds that refresh as still frames, with gaps of seconds or minutes.
- No output, no load, no emissions. Capacity on the card is nameplate, recorded at the time the dataset was built.
- No identification of people or number plates. The frames are low resolution by origin and the map adds nothing to them.
- Night is mostly useless. Many coastal and urban cameras go dark or noisy after sunset, and some operators switch them off entirely.
- Gaps are real. Small inland units, captive mine generation and recent commissioning are often absent, and absence on the map is never evidence of absence on the ground.
- No alerts about failures. A tripped unit or a regional blackout changes nothing visible in the layer.
Frequently asked questions
Is the South America power plants map free and live?
Yes, it is free and needs no account, but only half of it is live. The plant cards are static inventory (fuel, listed capacity, operator) and they do not stream the plant. What updates while you watch are the nearby public cameras, the flights overhead and the ships in the ports beside them.
Which is the biggest power plant you can see in Buenos Aires?
COSTANERA is the largest unit on the Buenos Aires waterfront in the layer, a coal plant run by ENDESA COSTANERA, with the gas plant NUEVO PUERTO (operator CT PUERTO SA) right next to it. Both sit inside the city, metres from the port, which is why traffic cameras often frame them by accident.
Why are there so few power plants shown in some countries?
Because the layer maps facilities that public datasets place with coordinates, and coverage is uneven across the continent. Argentina, Peru and Ecuador are well represented near the coast, while smaller inland units, backup diesel sets and plants under construction are frequently missing. A country looking empty on the map means missing data, not a country without electricity.
Can I see a blackout happening on the map?
No. There is no live load or outage feed in the layer, so a blackout does not change the colour of anything. What you can do is watch the indirect signals: city cameras that go dark at an odd hour, port activity, and news events plotted nearby. Treat those as hints, never as confirmation.
Are dams and power plants the same layer?
No, they are separate. Hydro appears twice: the generating station sits in the energy layer, while the structure holding the water sits in the dam layer, 5,356 of them worldwide. Mazar in Ecuador is a good example, listed with its use, its length and its power. If you only open one layer you lose half the hydro picture.
- Norway power plants on the map: hydro, dams and live views
- Nuclear power plants around the world: where they are and how they are monitored
- How Long Do Power Outages Last in Puerto Rico? Causes & Management
- China Power Plants Map: What ARGOS Atlas Actually Shows
- Russia Power Plants Map: 545 Sites, Live Grid View
- Power Plants in the United States: What the Map Actually Shows