Blog · OSINT & verification
Lebanon Live Map: What 90 Days of Open Data Show
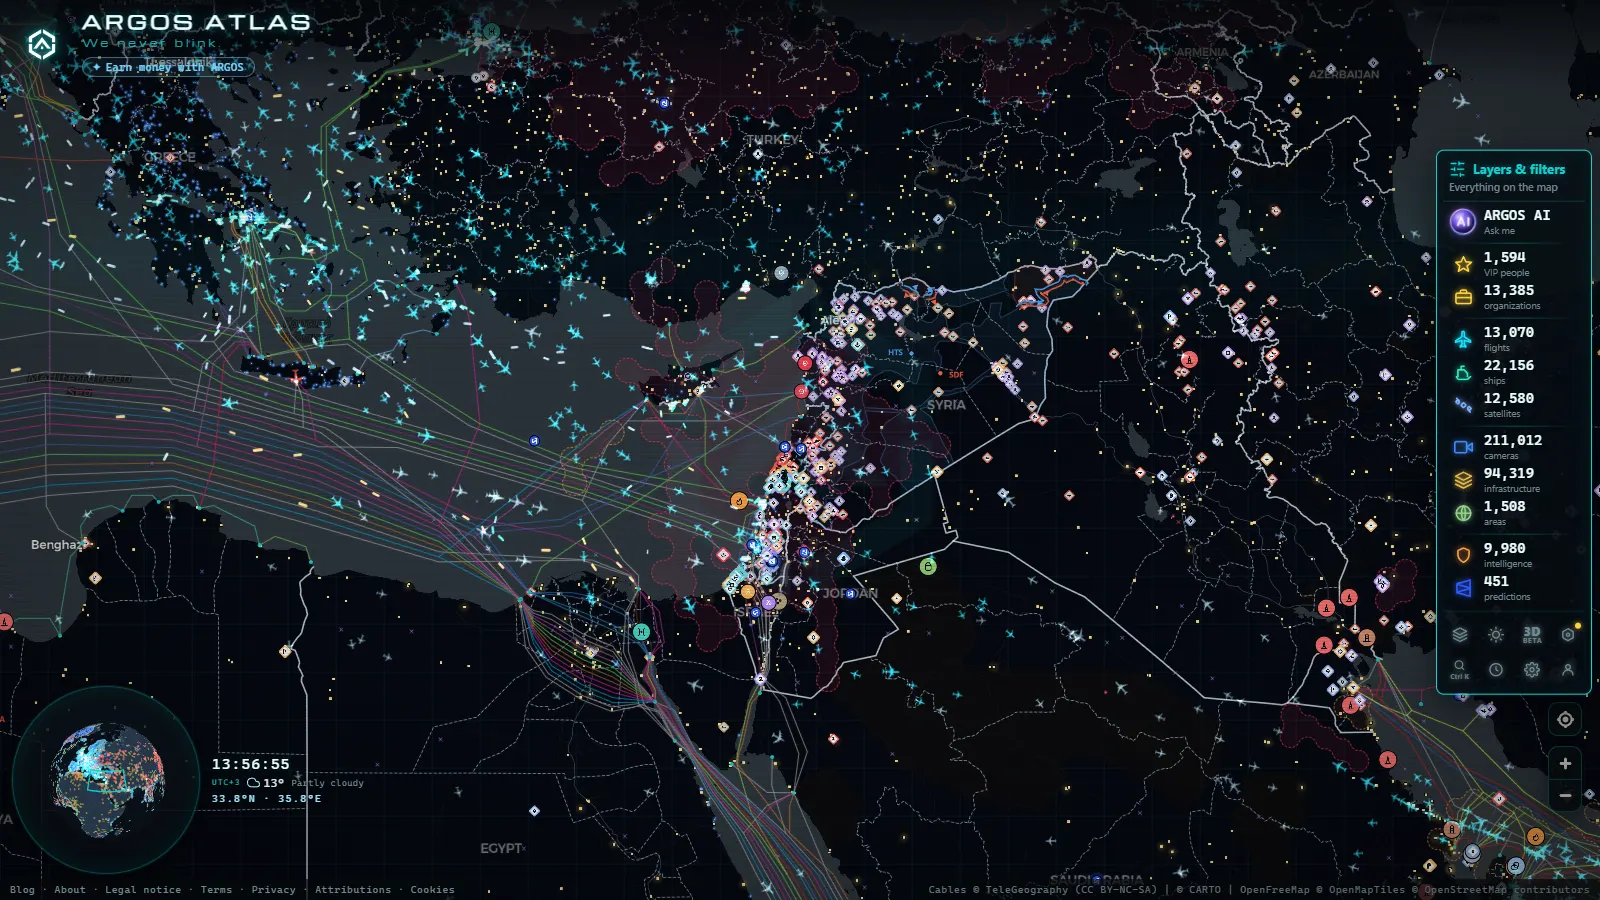
Open a Lebanon live map expecting a front line painted in red and you will be let down. What open sources actually produce for Lebanon is thinner than a command centre display and a good deal more honest: dated, located, individually sourced event records, plus a set of machine feeds (aircraft transponders, ship transponders, fixed infrastructure) that keep reporting whether or not anyone on the ground files anything that day.
This is not a war report, and as a war report it would be stale within hours. It is the method for reading one. Lebanon is a useful teaching case precisely because it sits where all of it overlaps: a small country, a crowded airspace, a busy coast, one international airport, and an information environment where the same forty second clip circulates under four different captions before lunch.
What a Lebanon live map is actually made of
Four separate things get stacked under that single phrase, and they share nothing except a coordinate system.
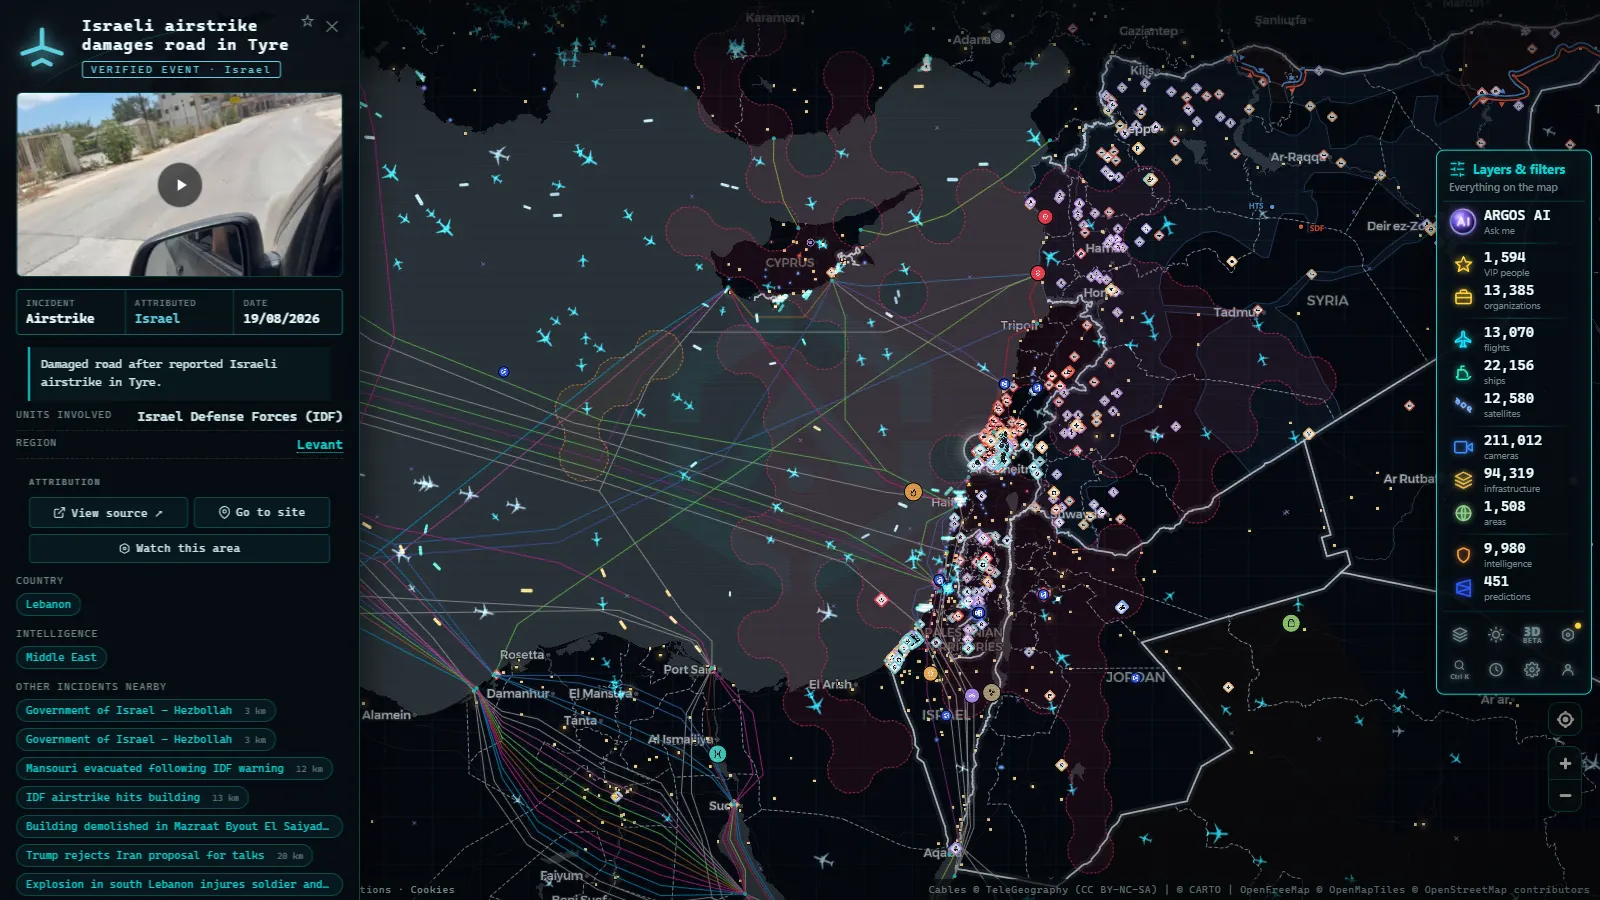
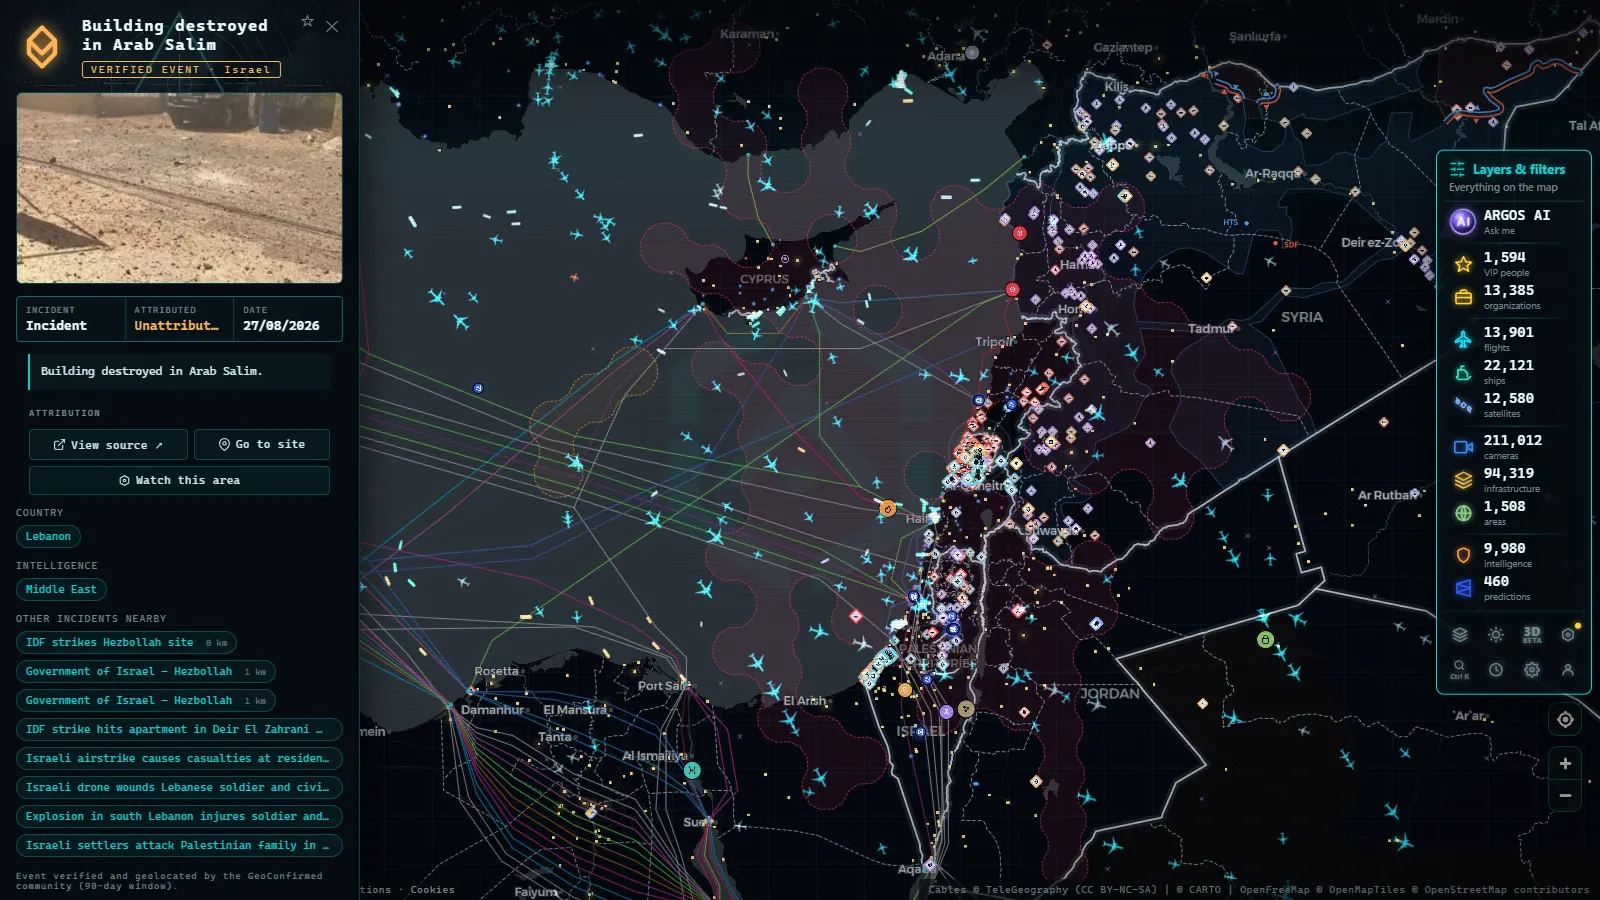
The first is the event layer: individual incidents with a date, a position and a source attached. Worldwide it holds 2,032 events in a rolling 90 day window, of which 1,088 carry video. The window matters more than the total. Anything older falls off, so the layer answers "what has been recorded here lately", never "what has happened in this conflict".
The second is conflict geometry: 16 fronts covering 986 km, across 8 theatres and 238 zones. These are lines and areas built from reported control and activity, updated on a slower clock than the events. They are an editorial product. Best current reading, not survey data.
The third is machine telemetry: aircraft broadcasting ADS-B, vessels broadcasting AIS, and static assets (airports, ports, power infrastructure) that do not move and therefore need no one to report them.
The fourth is press signal: 399 briefs and 1,539 GDELT items globally. That is text about events, not events. It is good for noticing that attention has spiked somewhere. It establishes nothing on its own, and treating a wire spike as evidence is the single most common mistake in this field. If the vocabulary here is new, the plain language version is in our explainer on what OSINT actually is.
One more layer is worth knowing about in this region: 74 mapped GPS interference zones. Whether one covers the Eastern Mediterranean on the day you look is something you check on the map, not something an article should promise you.
Where the recorded events cluster, and what that really tells you
When events do get recorded in Lebanon, they concentrate in a few predictable places: the southern border strip, the Beqaa corridor, the southern edge of Beirut, and the coastal road that connects them. Every map of this kind produces roughly that shape.
Here is the part most dashboards never say out loud. A cluster of dots is a map of where recording happens, laid over where things happen. Those two are not the same surface. Dots need someone with a phone, a working network, a reason to publish and a willingness to be identified as the person who published. Remove any one of those and the area goes quiet on the map while staying loud on the ground.
So read empty space as a question, never as an answer. A district with no events in 90 days might be calm. It might also have lost power, lost connectivity, or lost the people who were doing the posting. The map cannot distinguish those three, and neither can you from the map alone.
Verified, reported, rumoured: three tiers on one surface
Everything that lands on an event layer belongs to one of three tiers, and the visual language of a map flattens all three into identical dots. You have to re-separate them by hand.
Verified means there is a primary artifact and it survives independent checks: the terrain in the frame matches the claimed place, the shadows and light match the claimed hour, and at least one source that is not downstream of the first says the same thing.
Reported means a credible outlet or official body stated it, with no artifact you can inspect. Most of any conflict map is this tier. It is legitimate. It is also not the same thing.
Rumoured means it is circulating. Old footage recaptioned, a clip from another country, a simulation, a real event moved three years and four hundred kilometres. Lebanon gets a heavy dose of this because the region generates enormous engagement and recycled footage travels faster than corrections do.
The practical filter takes about ninety seconds per item: find the earliest copy, not the one you were sent; check whether the frame can be matched to a real street; check whether the sky and shadows fit the stated time; and ask who benefits from you believing it. The full workflow, with the traps, is in our guide to verifying a viral video step by step.
From the ARGOS ATLAS channel.
The layers that keep giving signal when local reporting stops
This is the reason to keep a map open at all during an information blackout. Transponders do not care whether journalists are working.
Aircraft. Around 12,379 aircraft are broadcasting position at a given moment worldwide, of which roughly 140 carry a military tag, plus 4,132 positions that are estimated rather than directly received. Estimated means interpolated between reports, and over a long gap the interpolation is a guess with a nice icon on top. For Lebanon the readable signal is mostly civil: approaches into Beirut that are flown or abandoned, diversions to Larnaca or Amman, cargo and tanker traffic, and the shape of airspace that suddenly nobody crosses. Combat aircraft on operations generally do not broadcast, so their absence is the normal state and proves nothing.
Ships. 21,484 vessels are visible at once and 38,336 have been tracked across the window. AIS gives identity, course, speed and draught, which makes the Lebanese coast legible in a way the interior is not: vessels holding offshore, port calls that stop, a tanker that goes dark for six hours and reappears somewhere inconvenient. AIS can be switched off and it can be spoofed, and coastal receiver coverage is uneven. How AIS works and where it lies is worth twenty minutes before you build an argument on it.
Fixed assets. 1,081 ports, 34,936 power installations and 47,927 airports give you the where of critical infrastructure. They report location, never status. A substation on the map is a substation that exists, not a substation with current running through it.
Layer by layer: what each feed can and cannot tell you
Global catalogue scale as of September 2026. These are worldwide totals, not Lebanese counts, and that distinction is the whole point of the last column.
| Layer | What it reports | Global scale | Where it fails |
|---|---|---|---|
| Events (90 days) | Located, dated, sourced incidents | 2,032 events, 1,088 with video | Nobody recorded, or nobody dared publish |
| Conflict geometry | Fronts, theatres, zones | 16 fronts, 986 km, 8 theatres, 238 zones | Slower clock than the events it summarises |
| Aircraft (ADS-B) | Civil traffic, some military | 12,379 airborne, 140 military tagged | Transponder off, which is routine on operations |
| Estimated positions | Interpolation between reports | 4,132 | Long gaps produce confident looking fiction |
| Ships (AIS) | Identity, course, speed | 21,484 visible, 38,336 tracked | Dark vessels, spoofing, receiver gaps |
| Ports and airports | Fixed maritime and air assets | 1,081 ports, 47,927 airports | Location only, never operational status |
| Power infrastructure | Plants, substations, lines | 34,936 | Says nothing about whether the lights are on |
| Sanctioned fleet | Flagged vessels and aircraft | 1,540 vessels, 342 aircraft | Names, flags and owners change fast |
| Public cameras | Live street level views | 171,279 worldwide, none from Lebanon | No Lebanese authority publishes an open feed |
| Press signal | Wire and media volume | 399 briefs, 1,539 GDELT items | Measures attention, not events |
How to read the Lebanon live map in ten minutes
A repeatable pass beats doomscrolling every time.
- Open the live map and set the event layer to the full 90 day window before you judge anything. A 24 hour view of a quiet day tells you nothing.
- Look at the clusters, then deliberately look at the gaps and ask which of the three explanations fits: calm, no connectivity, or no publisher.
- Turn on flights. Note what is flying into Beirut and what is diverting. Note that estimated positions are not observations.
- Turn on vessels. Watch port calls and anything holding offshore rather than proceeding.
- Pick one event with video and run the verification pass on it yourself. One item done properly teaches more than fifty skimmed.
- Write down what you could not establish. That list is the honest output.
The same routine works anywhere the local picture is thin. We ran it over restricted airspace in the Area 51 open source walkthrough, and the lesson was identical: the interesting finding was usually the absence, not the icon.
What a Lebanon live map will never give you
It will not give you casualty figures. Those come from institutions with people on the ground, and they arrive late, revised and contested. Nothing in a transponder feed produces them.
It will not give you intent. You can see an aircraft's track and a ship's course. You cannot see a decision.
It will not give you completeness. Every layer here has a defined coverage: ADS-B needs receivers in range, AIS needs coastal stations, the event layer needs a human to publish and another to review. Lebanon sits inside a region with good aviation and maritime coverage and no open camera coverage at all, which makes the sea and the sky legible and the streets opaque.
And it will not settle an argument for you. A map is a set of dated claims placed on a coordinate system. Used well, it stops you believing things that are not true, which is a smaller promise than most conflict dashboards make and considerably more useful.
Frequently asked questions
Is the Lebanon live map free, live and usable without signing up?
Yes. The map is open at /map/ with no account, no trial and no card. The event layer refreshes on a rolling 90 day window, flight and vessel positions update continuously while the feeds are healthy, and infrastructure is static reference data. There is nothing behind a form.
Does the map show a front line inside Lebanon?
The conflict geometry layer holds 16 fronts covering 986 km worldwide, drawn from reported control and activity. Whether a line is drawn over Lebanon on the day you look depends on what has been reported and reviewed. Read any front line as an editorial reading of open reporting, not as surveyed ground truth.
Why are there no live street cameras in Lebanon?
The camera catalogue holds 200,000+ public cameras (count as of September 2026), and they come from transport authorities that publish their feeds openly: highway agencies, city traffic departments, port operators. Lebanon has no such public feed in the catalogue, so there is no street level live view. Anything circulating as a Lebanese live camera deserves a hard look at where it actually points.
How do I tell a verified event from a rumour on the map?
Check four things in order: does the record point at a primary artifact (a clip, a photo, a statement) rather than at someone describing one; can the location be independently matched to terrain; does the capture time match the claimed time; and is there a second source that is not repeating the first. An event on the map is a sourced claim, not a proven fact.
Can aircraft and ship tracking show military activity over Lebanon?
Partially, and the gaps matter more than the hits. Around 140 aircraft carry a military tag globally at a given moment, and combat aircraft on operations usually do not broadcast at all. What you get is the civil picture: diversions, cancelled approaches into Beirut, tankers and transports that do broadcast, and vessels changing course offshore.
- Pakistan Airspace Map Live: Flights, Ships, No Cameras Yet
- Chernyakhovsk Air Base and Kaliningrad: What You Can Track
- Israel live map tracking: flights, ships and conflict events
- South America Air Bases Live Map: What You Can Really See
- Kerala live map: 4 international airports, ships and flights
- Turkey live map: Bosphorus ships, flights and road cameras