Blog · OSINT & verification
Ukraine War Map, Live: Front Lines and Black Sea Ships
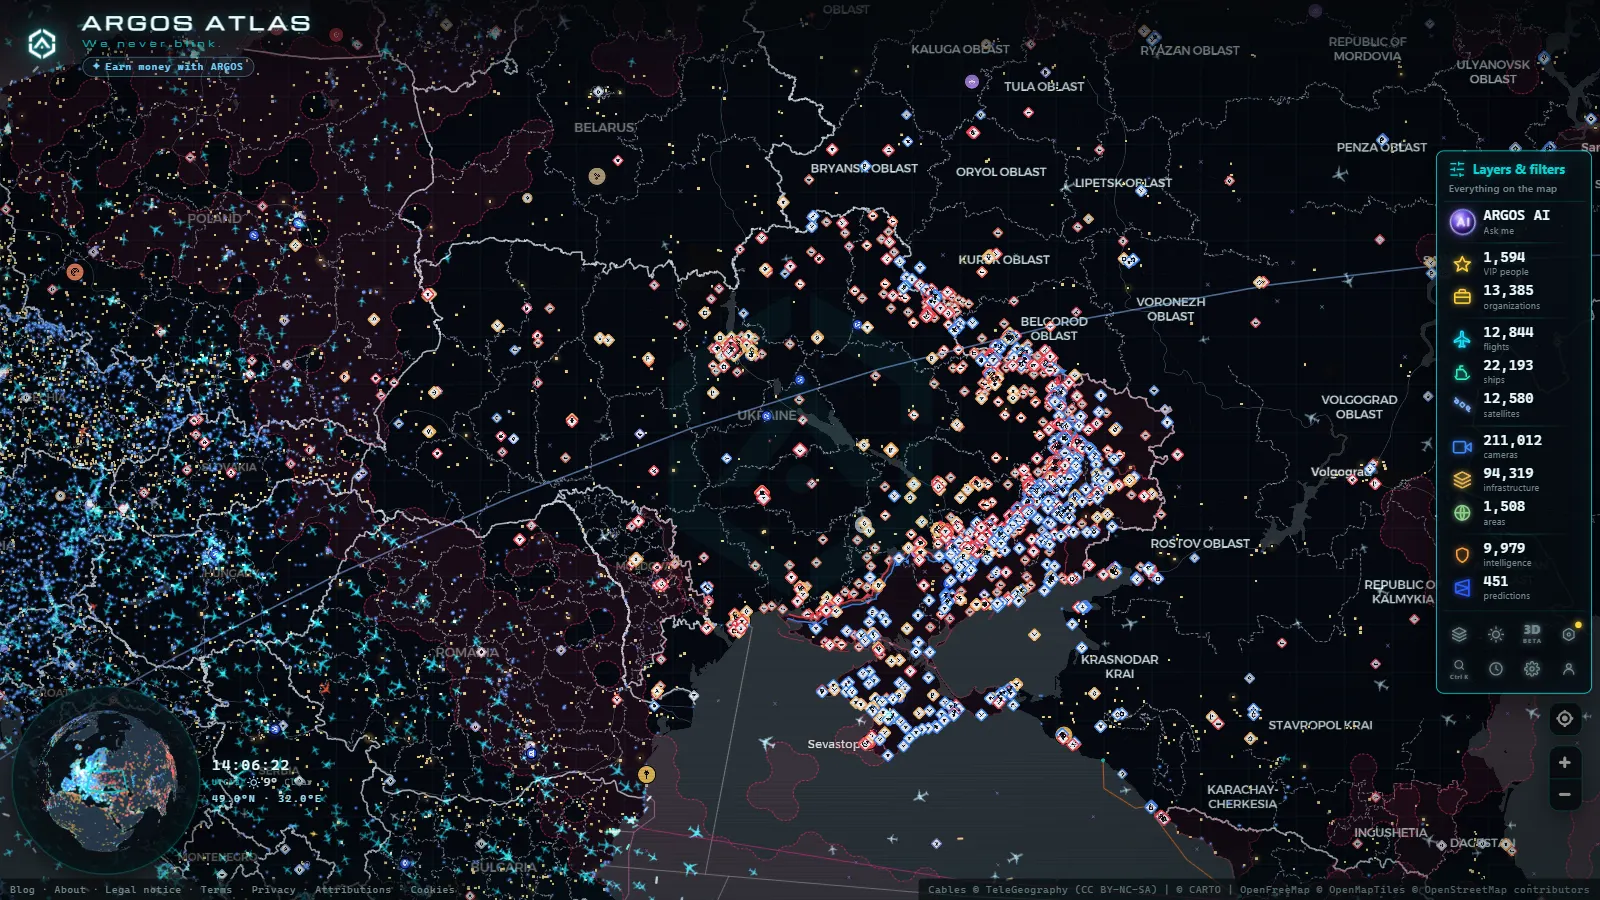
Type in "ukraine war map live" and you get dozens of dashboards promising real-time front lines. Almost none of them tell you where the dot on the map actually came from, or how old it is. ARGOS ATLAS isn't a war-tracking product built around Ukraine, it's a general OSINT map that happens to carry several layers relevant to it: conflict events, tracked front lines, ports, power infrastructure, and live AIS shipping. This piece walks through what each of those layers shows for Ukraine specifically, how stale the data can get, and (more importantly) what none of them will ever show you, no matter how often you refresh the page.
We're anchoring on two ports people already check without being told to: Sevastopol, the Russian Black Sea Fleet's main base in occupied Crimea, and Novorossiysk, the fleet's fallback anchorage on Russia's own coast since repeated strikes pushed ships out of Crimea. Both sit inside the same maritime layer as every other tracked port on the live map, which is exactly the point, you're not looking at a war-specific feed, you're looking at the general port and shipping layer with the war visible inside it.
Ukraine War Map Live: What the Layers Can Actually Track
The map runs several independent layers that happen to overlap on Ukraine rather than one purpose-built "war mode." The conflict layer plots reported events (strikes, incidents, front-line changes) sourced from open reporting and aggregated feeds, not from a single classified source. Across every conflict the map currently tracks worldwide, not Ukraine alone, that adds up to 17 tracked front lines spanning roughly 993 km and 8 active theatres. Ukraine is one of those theatres, but the map doesn't break that combined total down by country in the public dossier, so treat it as scale-of-effort context, not a Ukraine-specific figure.
Layered on top: a rolling OSINT digest of 2,869 briefs and 1,426 verification videos collected across a 90-day window, product-wide. Some of that volume is Ukraine-related, most isn't, it's the same pipeline that also watches the Sahel, the South China Sea, and Sudan. If you're using the map to follow Ukraine specifically, you're pulling one thread out of a much larger OSINT operation, which is worth knowing before you assume everything you see was collected for this war.
Sevastopol and Novorossiysk: The Two Ports People Already Watch
Both cities are tracked the same way as any other port on the map: as static port infrastructure entries with a live AIS overlay of whatever vessels are broadcasting nearby. There's no special "military base" mode, you get the same port marker you'd get for Rotterdam, plus whatever ships are currently transmitting a position.
That's genuinely useful for Sevastopol and Novorossiysk because both have had visible, repeated shifts in vessel activity since the invasion began, ships moving, ships staying dark, convoys forming and dispersing. What you're reading is traffic near a naval base, inferred from commercial and civilian AIS behavior, not a feed of naval movements themselves. Warships routinely turn their transponders off; that's the whole reason OSINT analysts watch merchant and tanker traffic around these ports as a proxy signal instead of tracking the fleet directly.
Reading the Conflict Layer: Events, Fronts, and Theatres
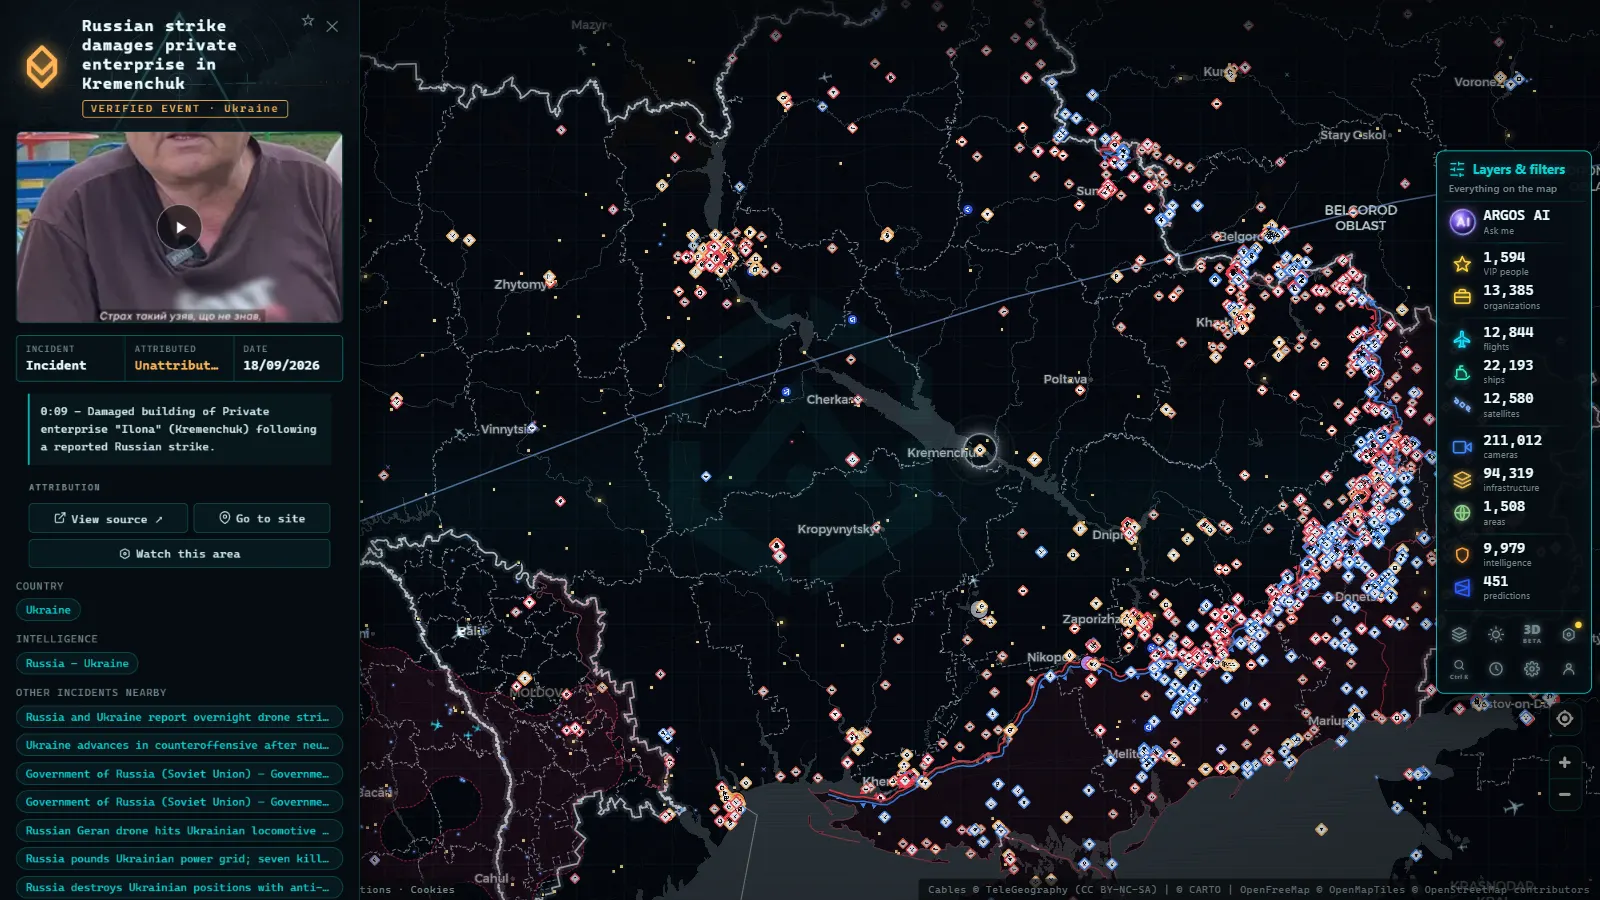
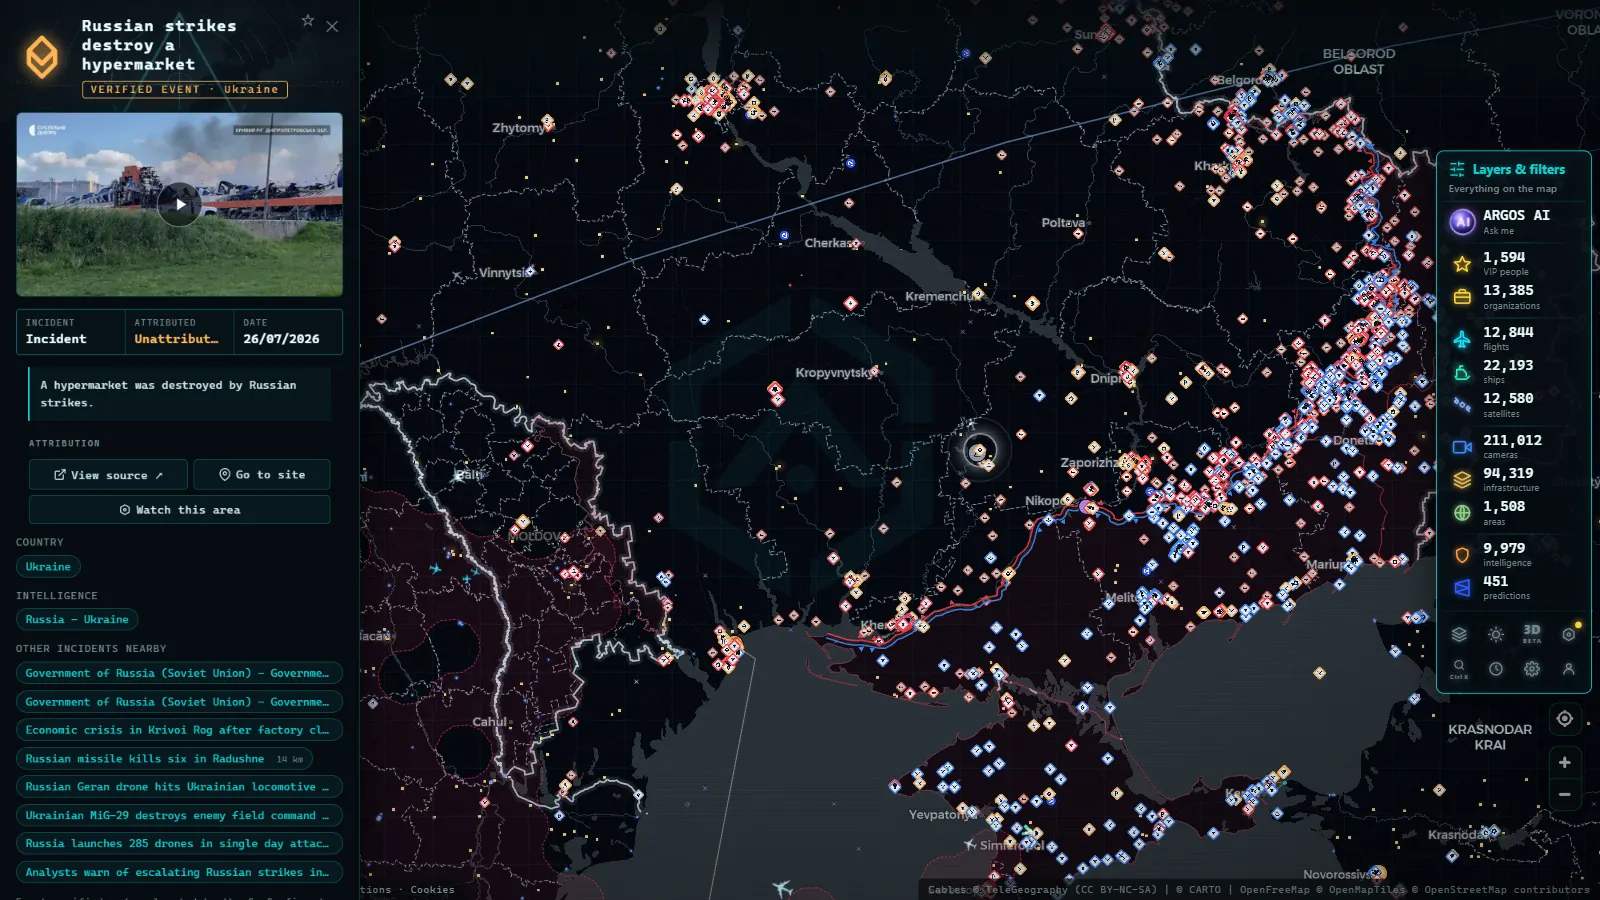
Each event on the conflict layer carries a source and a timestamp, that's the part most war maps skip, and it's the part that actually matters. A pin means "this outlet or feed reported this, at this time," never "this is confirmed and current." Front-line shapes are aggregated from multiple reporting streams and update on whatever cadence those upstream sources publish, not continuously. Between updates, the line on the map is a snapshot, not a live position.
The honest way to use this layer is as a discovery tool, not a verification tool: it tells you where to look closer (which city, which stretch of coast, which airbase) and then you cross-reference with imagery, OSINT accounts, or reverse image and video verification techniques before trusting a specific claim. A dot on a conflict map has never been sufficient evidence on its own, and treating it that way is how misinformation about this war has spread fastest.
From the ARGOS ATLAS channel.
Energy and Port Infrastructure Along the Front
Power infrastructure is one of the most fought-over target sets of this war, and it's also one of the map's largest layers: 34,936 power sites tracked globally (dated to August 2026), each with type and, where available, capacity. As with the conflict layer, the public dossier doesn't isolate a Ukraine-only subtotal, so don't quote a national figure from it, use the layer to locate specific plants, substations, and grid nodes near the front and check their status against current reporting, not to cite a national damage count.
Ports work the same way: 1,081 tracked port entries worldwide, of which Sevastopol and Novorossiysk are two. The value isn't a Ukraine-specific port count, it's that both cities sit inside a maritime infrastructure layer big enough to give you comparison points along the whole Black Sea coast, from Odesa's grain-corridor terminals to the Georgian and Turkish ports absorbing rerouted traffic.
Black Sea Shipping and the AIS Gap
The live ship layer tracks 37,044 vessels worldwide via AIS, the same open transponder system explained in our AIS ship-tracking guide. In the Black Sea specifically, this is where the map earns its keep: you can watch tanker and bulk-carrier traffic queuing near grain-corridor routes, or vessel density thinning out near Crimea when activity gets risky.
The gap is structural, not a bug: AIS is broadcast voluntarily by the vessel itself. A ship that switches its transponder off (which happens constantly in and around Crimean waters) simply disappears from every AIS-based map, ARGOS ATLAS included. So does anything the Russian or Ukrainian navies don't want tracked in the first place. What you're seeing is the traffic that chose to be visible, which skews toward commercial shipping and away from anything military.
What No Ukraine War Map Live Feed Can Show You
This is the part most war-tracking sites skip, and it's the part that actually matters for anyone using this seriously:
- No live camera coverage inside Ukraine. The map's largest layer, public traffic cameras, totals 176,048 feeds (recuento a agosto de 2026), but it leans almost entirely on cooperating road agencies in Western Europe and North America. A country with degraded infrastructure and no functioning public camera API isn't a hidden feed we're withholding, it's a layer that structurally can't reach there.
- No confirmed troop positions. Front-line shapes are aggregated from open reporting, not battlefield telemetry. Ground truth on the day of a strike is frequently contested for days.
- No dark-vessel or dark-aircraft tracking. Anything that turns its transponder off is invisible to AIS and ADS-B alike, by design of those systems, not a limitation specific to this map.
- No real-time damage assessment. Power and port infrastructure entries describe what exists and roughly where; they don't carry live status flags for whether a specific site was hit last night.
- No casualty or intelligence data. That's simply outside the scope of every layer this map runs.
If a site claims to show you all of that, live, for free, be skeptical of the claim before you're skeptical of us for not making it.
Ukraine War Map Live: Layer-by-Layer Summary
| Layer | What it shows near Ukraine | What it can't show | Update cadence |
|---|---|---|---|
| Conflict events | Reported strikes/incidents with source and timestamp | Confirmation, live troop positions | Depends on upstream reporting |
| Front lines & theatres | Aggregated front shape, 1 of 17 tracked fronts globally | Real-time front movement | Batch updates, not continuous |
| Ports (Sevastopol, Novorossiysk) | Static port infrastructure, 2 of 1,081 tracked ports | Naval-specific activity | Static entries |
| AIS shipping | Live transponder positions, part of 37,044 vessels tracked | Dark/off-transponder vessels | Near real-time while broadcasting |
| Power infrastructure | Located plants/substations, part of 34,936 sites tracked | Live strike/damage status | Static entries |
| Public cameras | Effectively none inside Ukraine | N/A, coverage gap | N/A |
How to Use These Layers Without Overtrusting Them
Treat every layer as a starting point for your own OSINT process, not a finished answer. Note the source and timestamp on any conflict event before repeating it. Cross-check unusual AIS gaps (a port suddenly empty of traffic) against actual reporting before assuming a strike happened; ships also just leave for ordinary commercial reasons. And if you're building your own verification habit around this war or any other, the OSINT techniques and satellite options in our free satellite imagery guide are the natural next stop, they fill the gaps a live map, by design, leaves open.
Frequently Asked Questions
Is this Ukraine war map really live, free, and available without sign-up? Yes. The map itself is free with no registration required. The shipping and camera layers update near real time while sources are broadcasting; the conflict and infrastructure layers update in batches as upstream reports come in, not continuously.
How current is the front-line data on the map? It's only as current as the aggregated reporting feeding it. Treat any front-line shape as a snapshot from the last update cycle, not a live position, and check the event timestamps before repeating a claim.
Can I see Russian warships directly on the map? No. Warships routinely switch off their AIS transponders, so the map can't track them directly. What you can watch is commercial and civilian shipping traffic around Sevastopol and Novorossiysk, which OSINT analysts use as an indirect signal.
Why don't I see traffic cameras inside Ukraine? The camera layer depends on cooperating public road agencies publishing feeds, the way the DGT does in Spain or 511 systems do in North America. Ukraine currently has no such feed integrated, so the gap is structural, not a hidden omission.
Does the map show troop movements or casualties? No. Neither is in scope for any layer the map runs. The conflict layer shows reported events with sources and timestamps, not verified battlefield positions or casualty figures.
Frequently asked questions
Is this Ukraine war map really live, free, and available without sign-up?
Yes. The map itself is free with no registration required. The shipping and camera layers update near real time while sources are broadcasting; the conflict and infrastructure layers update in batches as upstream reports come in, not continuously.
How current is the front-line data on the map?
It's only as current as the aggregated reporting feeding it. Treat any front-line shape as a snapshot from the last update cycle, not a live position, and check the event timestamps before repeating a claim.
Can I see Russian warships directly on the map?
No. Warships routinely switch off their AIS transponders, so the map can't track them directly. What you can watch is commercial and civilian shipping traffic around Sevastopol and Novorossiysk, which OSINT analysts use as an indirect signal.
Why don't I see traffic cameras inside Ukraine?
The camera layer depends on cooperating public road agencies publishing feeds, the way the DGT does in Spain or 511 systems do in North America. Ukraine currently has no such feed integrated, so the gap is structural, not a hidden omission.
Does the map show troop movements or casualties?
No. Neither is in scope for any layer the map runs. The conflict layer shows reported events with sources and timestamps, not verified battlefield positions or casualty figures.
- Area 51 Live Map: What Open Sources Really Show Over Groom Lake
- Kyiv Live Map: Closed Airspace, Live Grid, 90 Days of Events
- Nigeria Live Map: 90 Days of Conflict Data, and Its Limits
- Albania Live Map: What 90 Days of Open Data Really Show
- Algeria Live Map: Airports, Ships and the Camera Blank Spot
- Lebanon Live Map: What 90 Days of Open Data Show