Blog · OSINT & verification
Nigeria Live Map: 90 Days of Conflict Data, and Its Limits
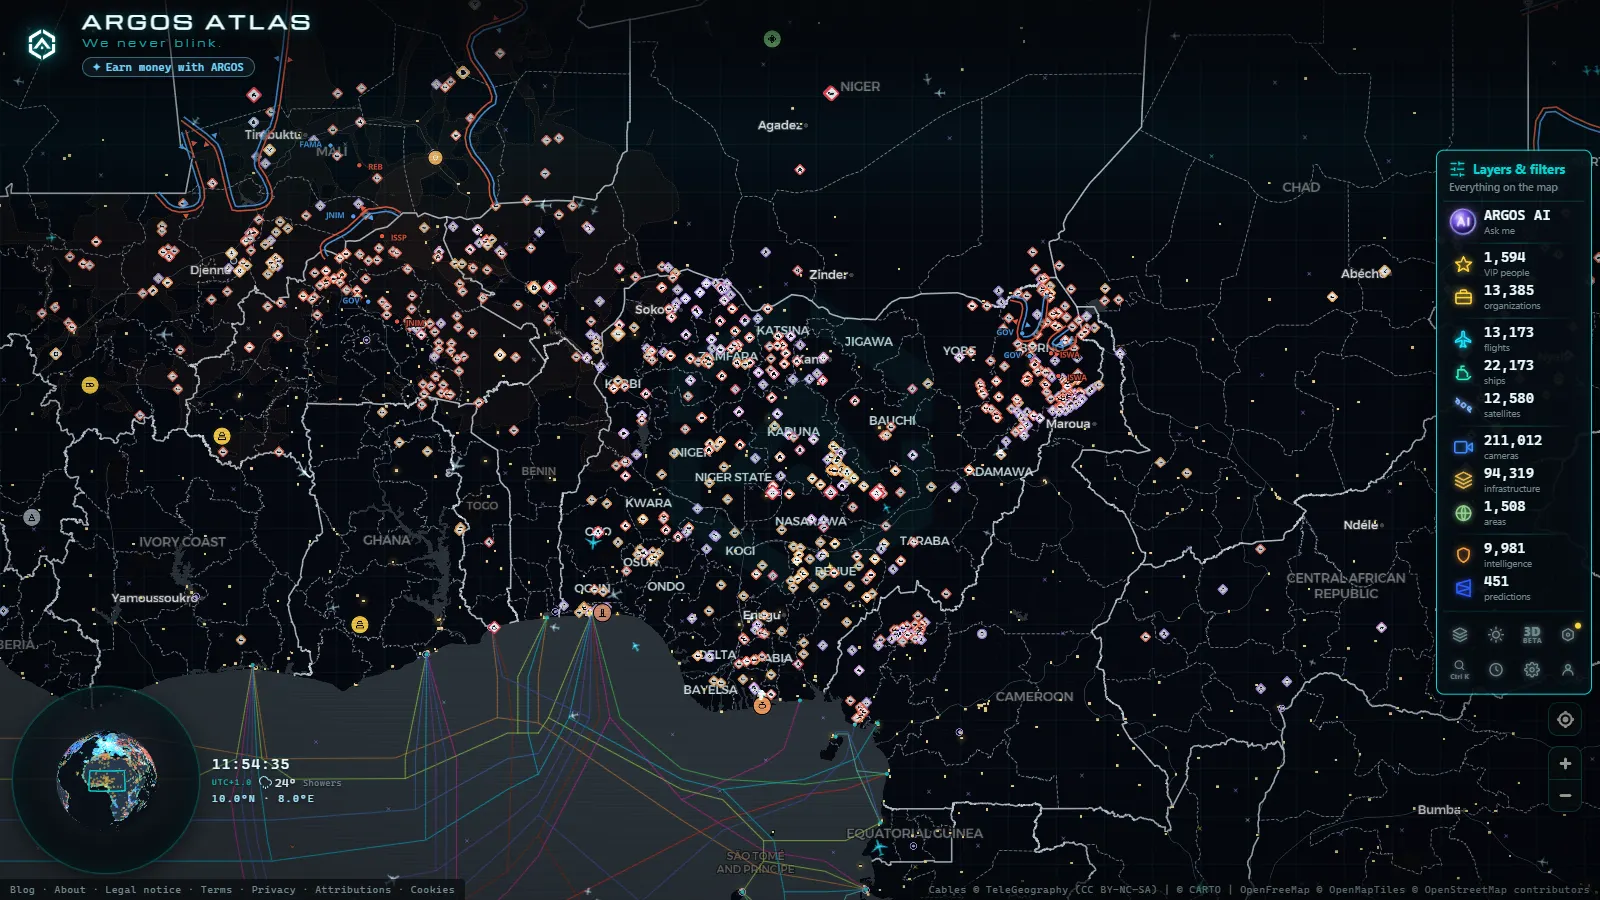
Nigeria is a country that open source tools handle badly, and that is worth saying before anything else. It is large, it has more than one armed conflict running at the same time, and the places with the most violence tend to be the places with the least public data. If you open a live map expecting a marked front line, you will not find one. There is no front line to draw.
What you do find is a stack of separate layers, each answering a different question: security incidents logged by research databases, ships moving in and out of the Niger Delta and Lagos, transponder traffic over the main airports, and fixed infrastructure that does not move at all. None of them answers "what is happening right now in Zamfara". Understanding why is more useful than any dashboard.
What Nigeria live map conflict data actually is
Three very different kinds of data get flattened into the phrase "live map", and they behave nothing alike.
Live positions come from transponders. Aircraft broadcasting ADS-B and ships broadcasting AIS announce their own position, and a network of receivers picks it up. Latency is seconds or minutes. This part is genuinely live.
Logged events come from research databases and news monitoring: ACLED, the Council on Foreign Relations Nigeria Security Tracker, GDELT. A person reads reports, codes an incident, assigns a date and a coordinate, and publishes in batches. Latency runs from days to weeks, and the coordinate is usually the nearest named town rather than the spot where something happened.
Static infrastructure (airports, power plants, ports, oil terminals) barely changes from one month to the next. It is context, not news.
Our own event layer holds a rolling 90 day window with 2,222 geolocated incidents worldwide, 1,053 of them with video attached, alongside 1,428 items from news monitoring. Those are global totals across every theatre we cover. Nigeria is a slice of them, and West Africa as a whole is thinner than those figures might suggest.
The layers you can open over Nigeria today
| Layer | What it shows over Nigeria | How fresh | The honest limit |
|---|---|---|---|
| Flights (ADS-B) | Airliners and cargo into Lagos, Abuja, Port Harcourt and Kano | Seconds to minutes | Ground receivers are sparse inland; low altitude and military traffic mostly absent |
| Ships (AIS) | Tankers, LNG carriers and offshore support vessels off the Delta and Lagos | Minutes | A transponder can be switched off; offshore coverage depends on satellite passes |
| Security events | Coded incidents in the northeast, northwest and Middle Belt | Days to weeks | Location is usually the nearest town, and absence of events is not absence of violence |
| News signals | Where reporting volume is concentrated | Hours | Measures coverage, not violence |
| Airports | Runways and airfields nationwide | Static | Includes strips with no scheduled traffic at all |
| Power and ports | Generation sites and port facilities | Static | Operating status (running or down) is not published anywhere |
| Public cameras | Nothing | n/a | Of 200,000+ cameras in the catalogue (count as of September 2026), Nigeria contributes no open feed |
That last row is the one people find hardest to accept. Traffic camera networks are public in Spain, Britain, Ontario, New York and Illinois because the road authorities there publish them as open data. Lagos and Abuja both operate camera systems. They are not open feeds, so they cannot be ingested and they are not on the map. Saying so is more useful than filling the gap with something that looks like coverage.
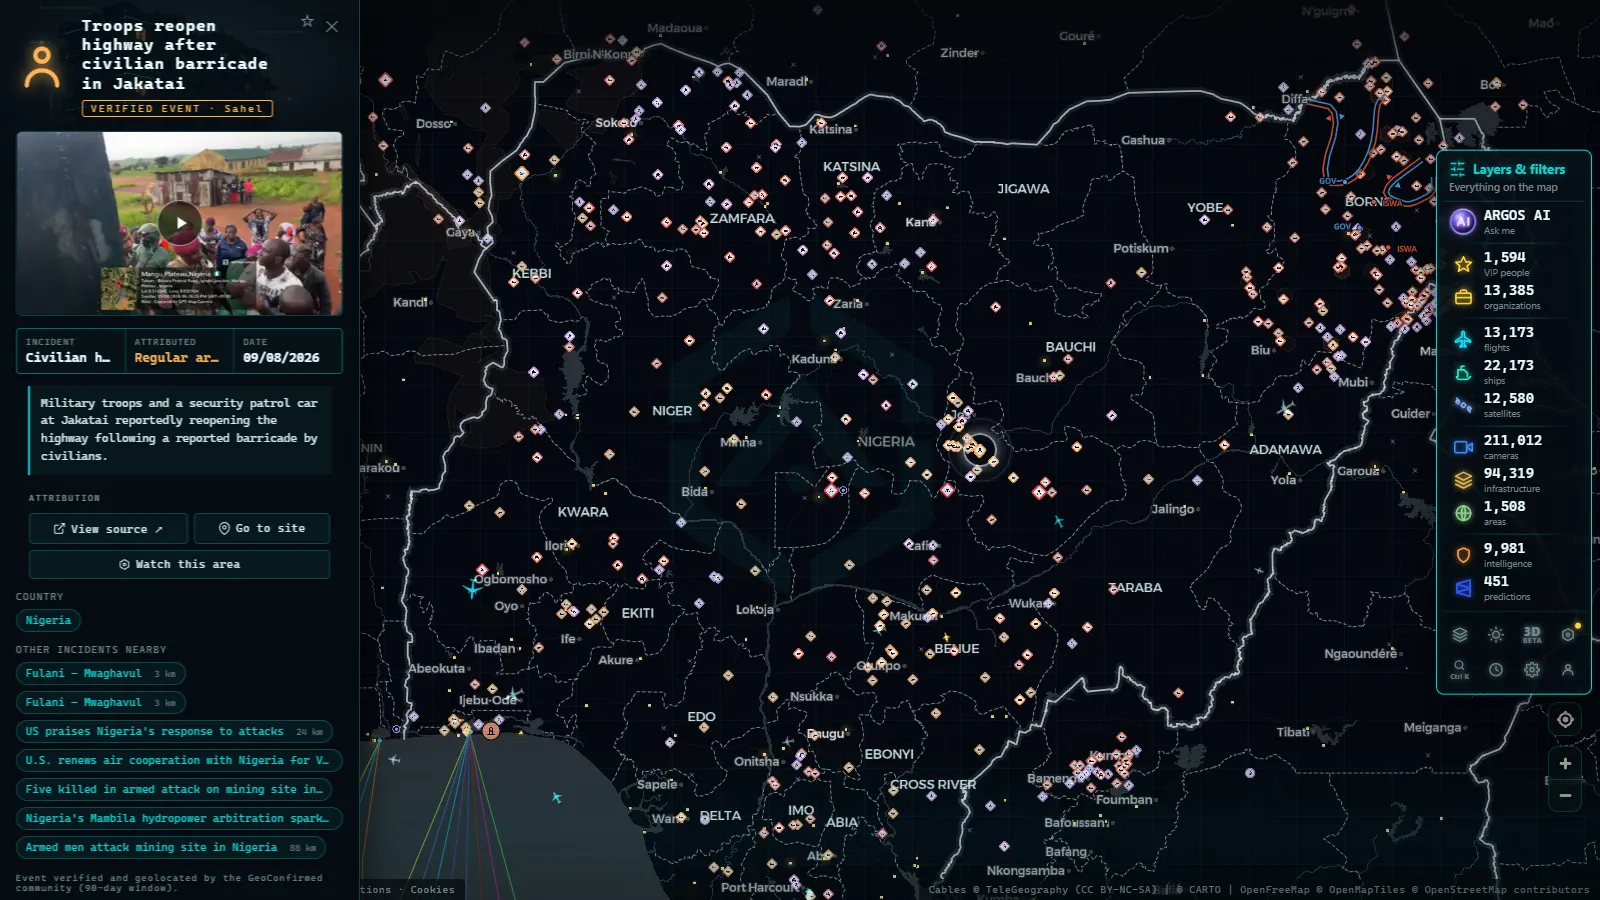
Security events arrive late, and they are not a war report
The single most common mistake with Nigerian conflict data is reading an event map as a live casualty ticker. It is not one, and it was never built to be.
Event databases work in coding cycles. Analysts collect press reports, local radio, statements and social media, decide whether an incident meets the inclusion criteria, geolocate it, and release the batch. A raid in rural Katsina on a Tuesday may enter the record ten days later, if a journalist reached it at all. Coverage follows reporters, and reporters follow roads, mobile signal and safety. All three thin out exactly where the violence concentrates.
So a quiet week on the map is frequently a week when nobody could report. State ordered telecommunications shutdowns have been used in the northwest as a counter banditry measure, and during those periods the event record for the affected states goes nearly silent while conditions on the ground do not improve.
There is a structural point too. We draw front line geometry for 16 segments across 8 theatres, covering 988 kilometres in total, and Nigeria appears in none of them. That is not an oversight. Front lines get drawn where a conflict holds ground along a continuous line, as in the live map of the war in Ukraine. Nigeria's conflicts are dispersed, overlapping and mostly non territorial. A line drawn across Borno would be a graphic, not a finding.
From the ARGOS ATLAS channel.
The Niger Delta corridor: what ships and ports reveal
The Delta and the Lagos approaches are the one part of Nigeria where open data is genuinely dense, because ships are legally obliged to broadcast and the traffic is commercially significant.
Zoom into the coast and the pattern is legible. Apapa and Tin Can Island handle container and general cargo for Lagos, with an anchorage of waiting vessels sitting offshore that grows and shrinks with congestion. Onne and Port Harcourt serve the oil services industry in Rivers State. Warri and Calabar handle smaller volumes further along the coast. Bonny Island is the LNG export point, and the tanker rotation there is one of the most consistent signals on the whole West African coast. Offshore, the loading terminals at Forcados, Escravos and Qua Iboe show as clusters of movement well away from land.
The map currently tracks 21,663 vessels with 40,113 seen in the wider tracking window, across 1,081 mapped ports, plus a layer of 1,540 sanctioned vessels. Those are worldwide counts. What matters for Nigeria is not the total but the behaviour: crude theft, illegal bunkering and kidnap for ransom at sea have all been documented patterns in the Gulf of Guinea, and none of them announce themselves on AIS. A vessel that goes dark for hours near a terminal is a lead, not proof. If you want the mechanics of why that happens, the guide on how AIS ship tracking works covers the spoofing and blackout cases in detail.
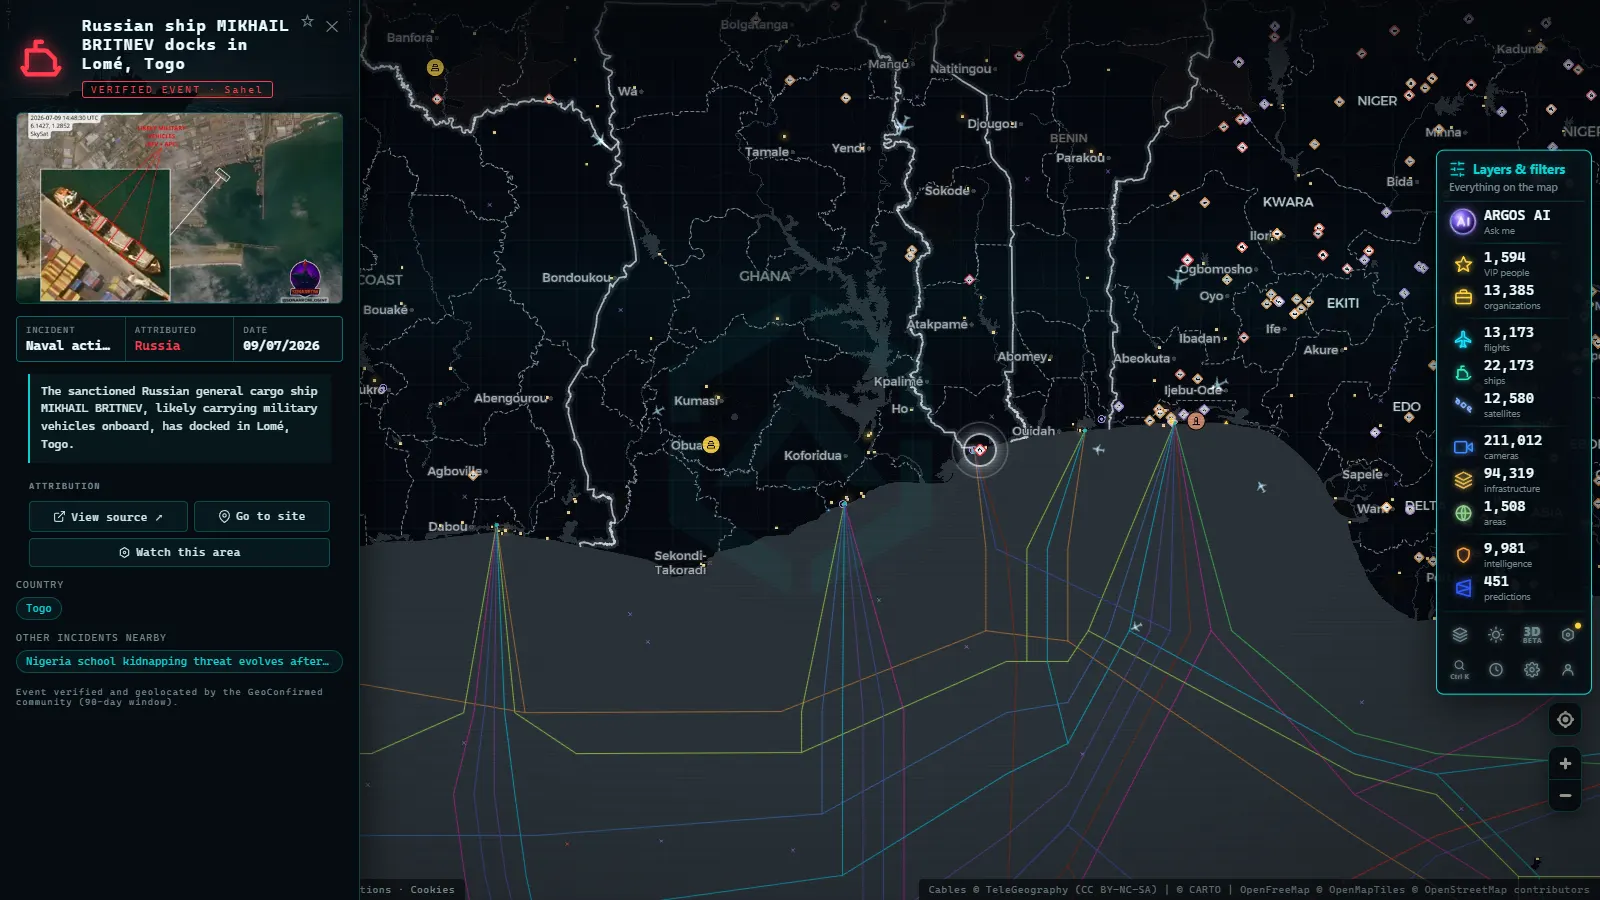
Flights over Lagos and Abuja
Air traffic is the second dense layer. Murtala Muhammed in Lagos and Nnamdi Azikiwe in Abuja carry the long haul routes from Europe, the Gulf and West African neighbours, with Port Harcourt and Kano taking the bulk of the remaining scheduled traffic. Domestic hops between Lagos and Abuja run frequently enough that the corridor is visible as a line of aircraft at almost any hour of the working day.
Coverage quality falls off fast away from those cities. ADS-B depends on volunteer receivers, and receivers need a hobbyist, mains power and internet. Southern Nigeria has some; the northeast has close to none. An aircraft over Maiduguri is broadcasting exactly as one over Lagos is, but if nothing on the ground hears it, the map shows empty sky.
Military aviation is the clearest gap. Of the aircraft currently airborne worldwide, 12,430 are visible on the map and only 229 carry a military flag, with a further 3,831 estimated positions. Counterinsurgency flights in the northeast are not going to appear in that set. The same reasoning applies elsewhere, which is why Iran looks emptier on the map than it really is. For the general method, see the guide on tracking aircraft in real time.
Where the open sources go quiet
Four rough zones behave differently, and it helps to hold them apart.
The northeast (Borno, Yobe, Adamawa, around Lake Chad) has the longest running insurgency and the most established reporting infrastructure, so events do get coded, but access is limited and rural incidents surface late.
The northwest (Zamfara, Katsina, Kaduna, parts of Niger State) has mass kidnapping and armed banditry with much weaker reporting. This is where the event record is least complete.
The Middle Belt (Benue, Plateau, Nasarawa) has recurring farmer and herder violence that gets reported in aggregate more often than incident by incident.
The southeast has separatist tension, enforced stay at home days and security force operations, and reporting there is heavily contested from all sides.
A single map view flattens all four into identical dots. They are not comparable, and treating a dot in Zamfara as equivalent to a dot in Lagos will lead you somewhere wrong.
Reading Nigeria live map conflict data without fooling yourself
A short working method, in the order that actually helps:
- Check the timestamp before the location. Every layer has a different refresh rate. Ask which one you are looking at before you conclude anything.
- Treat empty space as missing data. In Nigeria, blank almost never means peaceful. It means no receiver, no reporter or no feed.
- Use the static layers as context. Airports, ports and power sites tell you what is at stake in a place, which is often the point of an incident.
- Cross check anything that matters. A single coded event with no video and no second source is a lead, not a fact.
- Write down what you could not verify. The unverified column is the honest part of any open source work, and it is the habit that separates research from reposting. The introduction to OSINT and how it works walks through the same discipline with worked examples.
All of the layers above sit on the live map: open it, use the side rail to switch between flights, ships, security events and infrastructure, and pan to the Delta first, because that is where Nigeria is genuinely observable. Everything north of it deserves more caution than a map interface naturally invites.
Frequently asked questions
Is the Nigeria live map free, live and available without signing up?
Yes. The map opens with no account, no email and no trial. Flights and ships are live positions from transponders, refreshed continuously. The security event layer is a rolling 90 day window of logged incidents, so it is recent rather than instant, and it is labelled that way on purpose.
Can I see a front line in Nigeria like the one drawn for Ukraine?
No, and that is deliberate. Front line geometry is only drawn where a conflict holds territory along a continuous line. Nigeria's conflicts are dispersed: insurgency around Lake Chad, armed kidnapping in the northwest, farmer and herder violence in the Middle Belt, oil theft in the Delta. Drawing a line across any of them would be fiction.
Why does the map show almost no aircraft over northern Nigeria?
ADS-B coverage depends on volunteer ground receivers, and they cluster near cities with hobbyists and reliable power. Northern Nigeria has few. Aircraft flying there are broadcasting, but often nobody is listening. An empty area on a flight map means no receiver, not no flight.
Are there public traffic cameras in Nigeria on the map?
No. The catalogue holds 200,000+ cameras (count as of September 2026), almost all of them published by road and transport authorities in Europe and North America. Nigerian cities operate camera systems, but the feeds are not open, so there is nothing to ingest and nothing to show.
How reliable are ship positions off the Niger Delta?
Reliable while the transponder is on. AIS is self reported, so a vessel can switch it off, report a false position, or drift out of terrestrial receiver range and depend on satellite passes. Treat a gap as a question rather than an answer: quiet stretches of coast are often the interesting ones.
- Albania Live Map: What 90 Days of Open Data Really Show
- Algeria Live Map: Airports, Ships and the Camera Blank Spot
- Lebanon Live Map: What 90 Days of Open Data Show
- Pakistan Airspace Map Live: Flights, Ships, No Cameras Yet
- Chernyakhovsk Air Base and Kaliningrad: What You Can Track
- Israel live map tracking: flights, ships and conflict events