Blog · OSINT & verification
Kyiv Live Map: Closed Airspace, Live Grid, 90 Days of Events
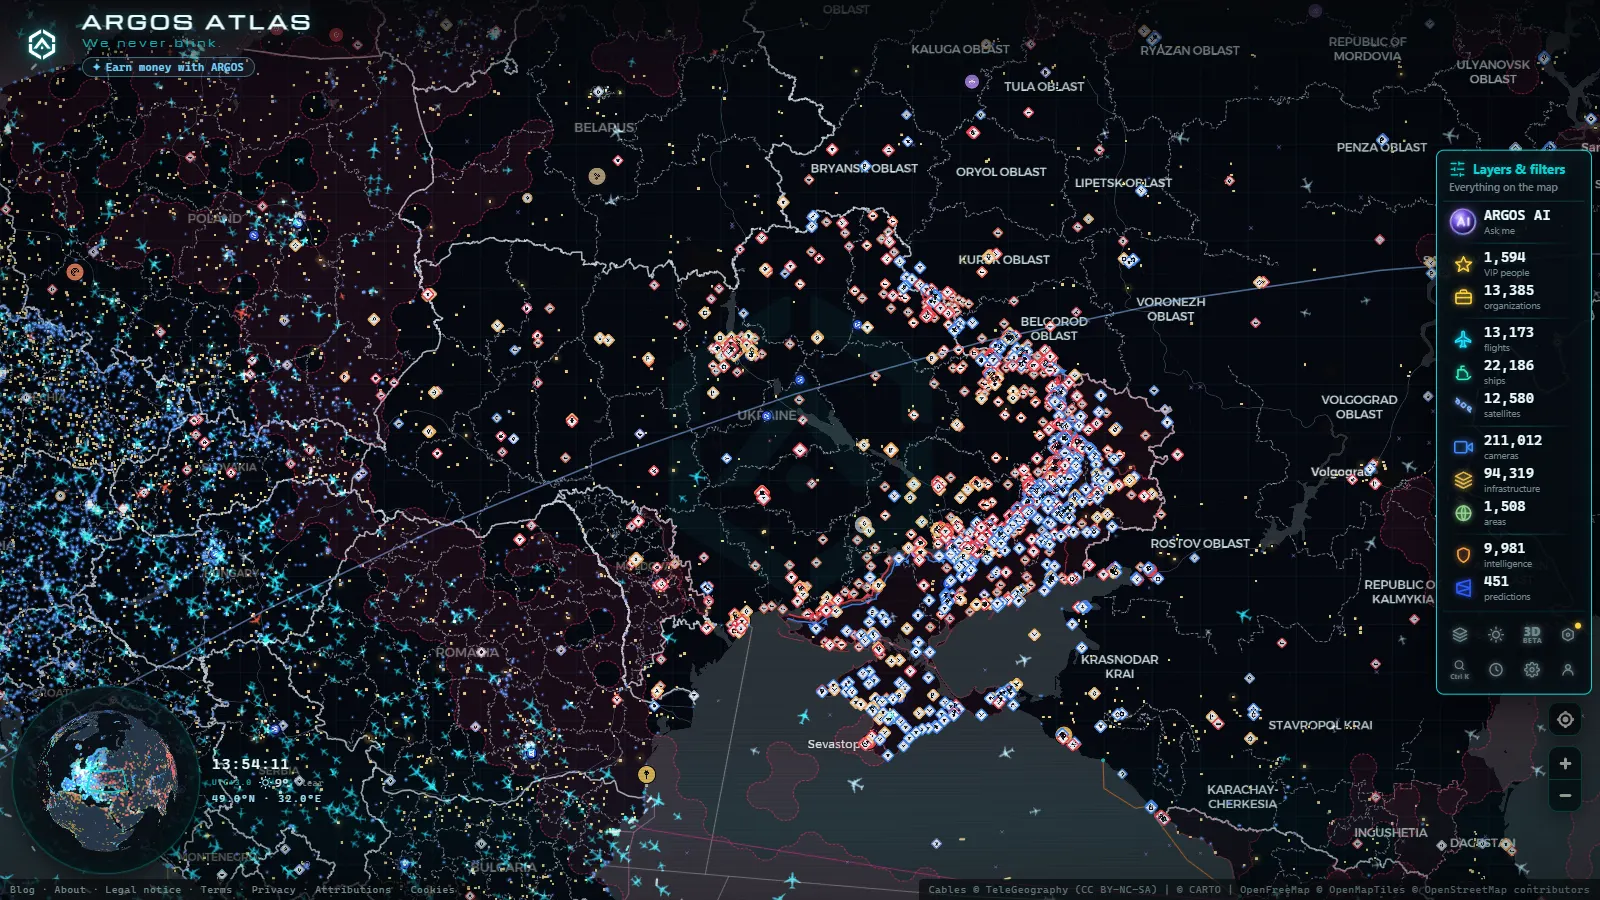
Search for a kyiv live map and you get a wall of dashboards promising real time everything. Most of them are one of three things: a static pin map, a news feed wearing a map skin, or a flight radar whose Ukrainian sky has been empty since the full scale invasion began. The useful answer is narrower than any of them. Over Kyiv, some layers are genuinely live, one is permanently blank for a very good reason, and a couple that people assume exist simply do not.
This piece is about the city. If what you want is the front line, the theatres and the Black Sea ports, that belongs to the live map of the war in Ukraine. Here we stay inside Kyiv and its oblast, and we say out loud which layers are worth your attention and which ones are going to disappoint you.
What a Kyiv live map actually shows today
Open the ARGOS ATLAS live map, centre it on Kyiv and turn the layers on one at a time. Three of them have something real to say about the city:
- Energy infrastructure. Thermal and combined heat and power plants, high voltage substations and transmission nodes across the metropolitan area, with position, name and type.
- Conflict events. Geolocated incident reports for the region, each with a timestamp and, in many cases, an attached video or photograph from the original source.
- Airports and airfields. Boryspil, Zhuliany and Hostomel all appear as points with identifier and runway data. What they do not have is traffic.
Everything else you might reasonably expect (street cameras, river traffic, a working arrivals board) is either absent or deliberately empty. The rest of this article explains each case, because knowing why a layer is blank is worth more than a pin that pretends otherwise.
The airspace over Kyiv is closed, and the empty layer is the story
Ukrainian civil airspace has been shut to commercial traffic since the start of the full scale invasion. There are no scheduled arrivals at Boryspil to follow, no departures from Zhuliany, no cargo rotations out of Hostomel. A flight tracker centred on Kyiv is not broken when it shows an empty screen, it is reporting the situation accurately.
Two technical facts compound that emptiness. ADS-B tracking depends on the aircraft broadcasting its own position and on volunteer receivers on the ground picking that broadcast up. State and military aircraft routinely fly with the transponder off or with the identity filtered, and the receiver network inside a country at war is thin, unevenly distributed and frequently offline. Of the aircraft in the air worldwide at a given moment (12,338 tracked in a recent sample, of which 122 carry a military identity), the share over Ukraine rounds to nothing.
This reading habit transfers. An empty sky on a public radar means "nothing is broadcasting here", never "nothing is flying here". The same logic governs restricted ranges on the other side of the planet, which we pulled apart in what open sources really show over Groom Lake. Treat the gap as a data property, not as evidence of calm.
Kyiv's power grid is mapped, and its status is not
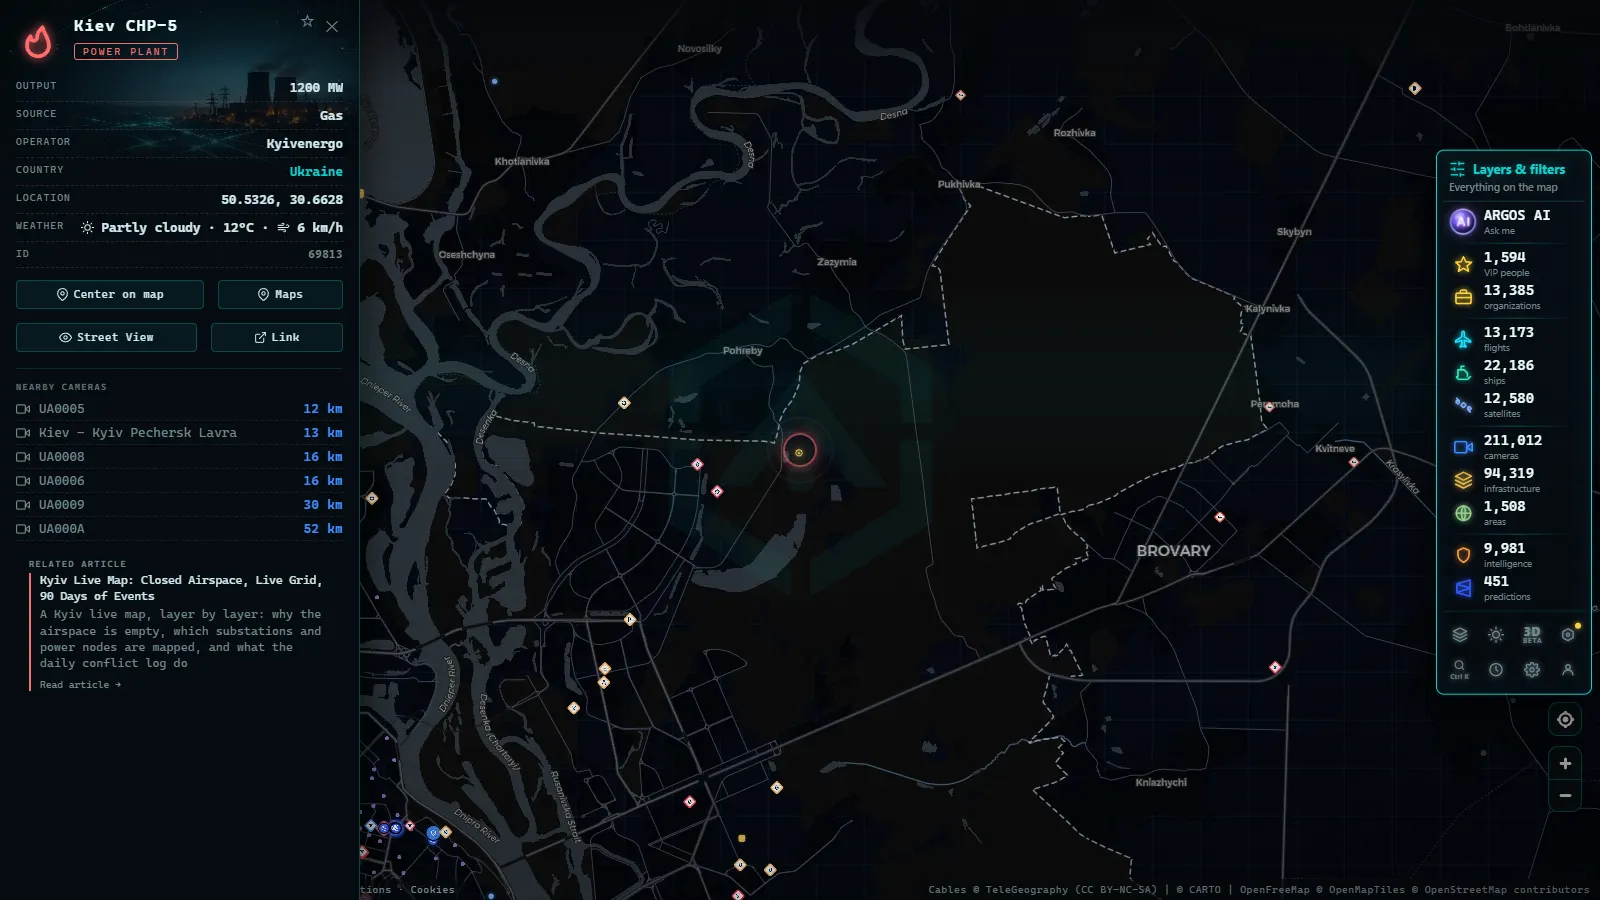
The energy layer is the one where the city genuinely appears. It holds 34,936 power infrastructure points worldwide (count as of September 2026), and the Kyiv cluster inside it covers the combined heat and power stations that feed the district heating network, the substations that step transmission voltage down for distribution, and the high voltage nodes ringing the region to the north and east. Ukrenergo operates the transmission backbone, and distribution inside the capital sits with DTEK's Kyiv grid company.
Here is the limit, and it matters more than the layer itself: this is a cartography of assets, not a control room feed. No utility anywhere publishes real time load, outage extent or damage status on an open endpoint, and in wartime Ukraine that information is a military secret rather than a data gap. What the map gives you is geography: where the nodes are, what type each one is, and therefore which parts of the city a given node plausibly serves. What it will never give you is whether that node is energised right now. Anyone selling you a live grid status map of Kyiv is selling you an inference dressed as a measurement.
The mirror image of this layer, on the other side of the border, is covered in our piece on Russia's power plants on the map. Same data model, same honesty about what a static asset layer can and cannot answer.
From the ARGOS ATLAS channel.
Conflict events around Kyiv, logged every single day
The OSINT event layer keeps a rolling 90 day window with 2,243 geolocated events, 1,023 of which carry video, alongside 1,438 signals derived from GDELT news monitoring. The wider frame it sits in covers 16 active fronts, 992 kilometres of mapped front line, 8 theatres and 198 zones.
Kyiv is not a front line city, so its entries cluster into one family: drone and missile impacts, air defence engagements and falling debris, and damage to energy or residential infrastructure. That pattern is exactly why the event layer pairs well with the energy layer. When you see repeated entries near the same substation over several weeks, you are looking at a targeting pattern, and the map lets you check it yourself instead of taking a headline's word for it.
The cadence is the honest caveat. Every event is a report published after the fact, usually minutes to hours later, sometimes a day later when geolocation takes work. This is a record, not an alarm. If you need to know that something is happening in Kyiv this minute, an air raid alert application is the correct tool and this map is not.
What a Kyiv live map cannot show you
- Street cameras. The camera catalogue holds 179,388 public feeds (count as of September 2026) and none of them are in Kyiv. Ukraine restricted public webcam streams early in the war because they were being used to adjust fire. Municipal and private cameras still exist in the city, but they are not open feeds and publishing them would be irresponsible even if they were.
- River traffic. The AIS layer tracks 21,507 vessels, and the Dnipro at Kyiv is effectively silent: commercial river traffic is negligible and inland receiver coverage is patchy at the best of times.
- Reliable positions. The map flags 54 GPS interference zones worldwide, and this region is one of the noisiest. Jamming and spoofing degrade both AIS and ADS-B, so any position reported from inside an interference zone can be wrong by kilometres.
- Alerts of any kind. No siren feed, no shelter status, no casualty figures. Those come from official Ukrainian channels and dedicated applications.
Layer by layer over Kyiv
| Layer | What it shows over Kyiv | How current it is |
|---|---|---|
| Energy infrastructure | Plants, CHP stations, substations, transmission nodes | Static cartography, revised when sources change |
| Conflict events | Geolocated incidents, many with attached video | Rolling 90 day window, new entries daily |
| Airports | Boryspil, Zhuliany and Hostomel as points | Static, with no scheduled traffic to show |
| Flights | Nothing over the city | Live, and legitimately empty |
| Public cameras | Nothing inside the city | No open feeds exist to ingest |
| Ships | Nothing on the Dnipro | Live AIS, no meaningful inland coverage |
| GPS interference | Regional jamming and spoofing zones | Updated as reports arrive |
How to read Kyiv on the map in five minutes
- Centre on Kyiv and zoom to the metropolitan ring, not to a single street. The useful patterns live at oblast scale.
- Turn on energy infrastructure alone first. Learn the geography of the nodes before you overlay anything on top of it.
- Add the conflict event layer and read it chronologically rather than as a cloud of pins. Repetition near the same coordinates is the signal.
- Open the events that carry video and check the frame against the location claim. A pin without a verifiable source is a claim, not a fact.
- Leave the flight layer on as a control. Its emptiness is your reminder of how much of this sky is simply not observable from open sources.
Verify before you share anything from Kyiv
Every high attention city produces recycled footage, and Kyiv produces more than most. Clips from previous years, from other Ukrainian cities and occasionally from other conflicts entirely circulate as breaking material within minutes. The map helps because it gives you a second, independent anchor: if a clip claims a strike on a specific district, you can check whether an event was logged there, whether there is infrastructure at that location that would explain it, and whether the surroundings in the video match the terrain.
That cross check is the whole discipline in miniature, and it is the same one applied to any region in eight OSINT techniques you can try today. Kyiv is a good place to practise it precisely because the easy layers are missing. With no street cameras and no air traffic to lean on, you are left with infrastructure, timestamps and your own reading of the footage, which is where open source verification actually happens.
Frequently asked questions
Is the Kyiv live map free, and do I need an account?
It is free and there is no registration. Open the map, centre it on Kyiv and switch layers on and off. Nothing is gated behind a sign-up form and no email is asked for.
Why are there no flights over Kyiv on any live tracker?
Ukrainian civil airspace has been closed to commercial traffic since the full scale invasion, so there is no scheduled traffic to display. On top of that, state and military aircraft usually fly with the transponder off, and the volunteer ADS-B receiver network inside the country is thin. An empty sky here means nothing is broadcasting, not that nothing is flying.
Are there public street cameras in Kyiv on the map?
No. Ukraine restricted public webcam streams early in the war because they were being used to adjust fire, and the catalogue of 200,000+ public cameras (count as of September 2026) contains none inside the city. Municipal and private cameras exist, but they are not open feeds and we do not publish them.
Does the power layer tell me whether a Kyiv substation has power right now?
It does not. The layer is a cartography of assets: plants, combined heat and power stations, substations and transmission nodes, with names and types. No utility publishes real time load or damage status, so you get position and function, never operational state.
How fresh are the conflict events shown around Kyiv?
The layer keeps a rolling 90 day window and new entries land daily, but each one is a report published after the fact, typically minutes to hours later. It is a record for verification and pattern reading, not an early warning tool. For alerts, use a dedicated air raid application.
- Nigeria Live Map: 90 Days of Conflict Data, and Its Limits
- Albania Live Map: What 90 Days of Open Data Really Show
- Algeria Live Map: Airports, Ships and the Camera Blank Spot
- Lebanon Live Map: What 90 Days of Open Data Show
- Pakistan Airspace Map Live: Flights, Ships, No Cameras Yet
- Chernyakhovsk Air Base and Kaliningrad: What You Can Track