Blog · Critical infrastructure
Copper mines Chile Peru map: 4 live layers, and the blind spots
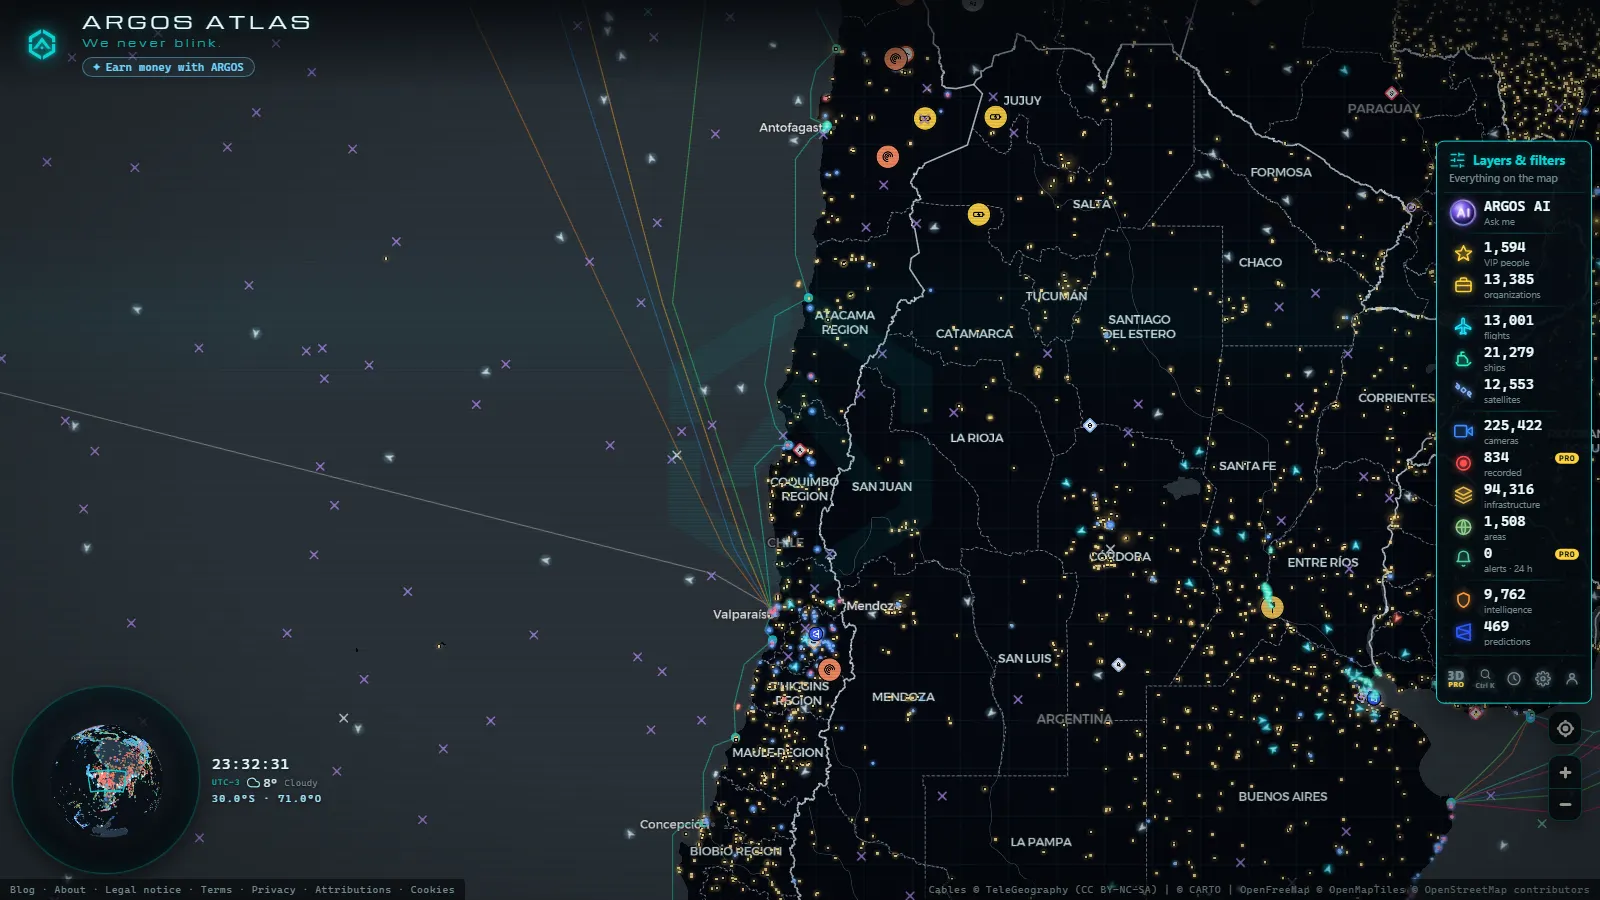
Four things around an Andean copper mine show up on a live map, and none of them is the mine itself: the private airstrip where the shift planes land, the tailings dam that stores the ground rock left after the copper is taken out, the power plants and lines that keep the crushers turning, and the port where the concentrate leaves the country. All four are free to open, with no account, on the live world map.
This is not an article about copper production. It is a short manual for watching a mining operation from the outside with public data: what each layer tells you about La Escondida (Atacama, Chile) and Antamina (Áncash, Peru), and the long list of questions the data flatly cannot answer.
The essentials, in 20 seconds
- La Escondida (Atacama, Chile): the operation runs its own airstrip inland from Antofagasta, one entry among the 47,927 airports and airfields in the aviation layer.
- Antamina (Áncash, Peru): its tailings dam is catalogued as an embankment dam, one of the 5,356 dams and reservoirs on the map.
- Power: 34,936 plants and substations are mapped worldwide, which is how you find the grid that feeds a pit nobody publishes live data about.
- Antofagasta: the loading port for northern Chile's copper, one of 1,078 ports, with 21,414 ships moving in the live AIS layer.
- No camera inside any pit: of 225,421 public cameras catalogued (count as of October 2026), not one points at a mine face.
What a copper mines Chile Peru map actually shows
Mining companies publish very little in real time, and nothing you could call a live feed. The infrastructure around them is a different story, because it is public for reasons that have nothing to do with mining: aircraft broadcast their position on ADS-B so other aircraft can avoid them, ships broadcast AIS for the same reason, and airfields, dams, power plants and port terminals sit in open registries and national cadastres that anyone can mirror.
So the method is not to watch the mine. It is to watch its edges, and to know which edge answers which question. Critical infrastructure on public maps is mostly this: assets too big and too connected to stay off the record, even when their owner would prefer otherwise.
The private airstrip at Escondida
Escondida sits high in the Atacama, a long drive inland from the coast. Crews work rotations, and the company flies them in: charter aircraft out of Santiago and Antofagasta land on the operation's own strip rather than at a city airport, because the alternative is hours of desert road at the start and end of every shift.
In the aviation layer the strip looks modest. One runway, no terminal, no scheduled service, a dot you would scroll past. What makes it legible is the rhythm around it. A runway with no airline presence that still sees several turboprop or narrow-body movements clustered at the same hours on the same weekdays is a shift-change strip, and that pattern is the most reliable outside signal that an operation is staffed and running normally. A week of silence on a strip like that is worth noticing.
From the ARGOS ATLAS channel.
Reading the shift flights over the Atacama
In practice: open the flight layer, zoom to the desert between Antofagasta and the Argentine border, and let it run. Most of what crosses the screen is overflight traffic at cruise altitude between Santiago and the north, which you can ignore. The interesting targets are low, slow, and they end nowhere near a city.
Then the honest caveat. Of the 13,294 aircraft in the layer when this count was taken, 4,129 were on estimated positions, meaning no receiver was hearing them directly and the map was projecting the track forward. The Atacama is exactly the kind of empty, high terrain where ground coverage thins out, so a mine flight can appear late, drift, or vanish on approach. The guide to reading a live flight radar covers what those estimated tracks mean before you build a theory on one.
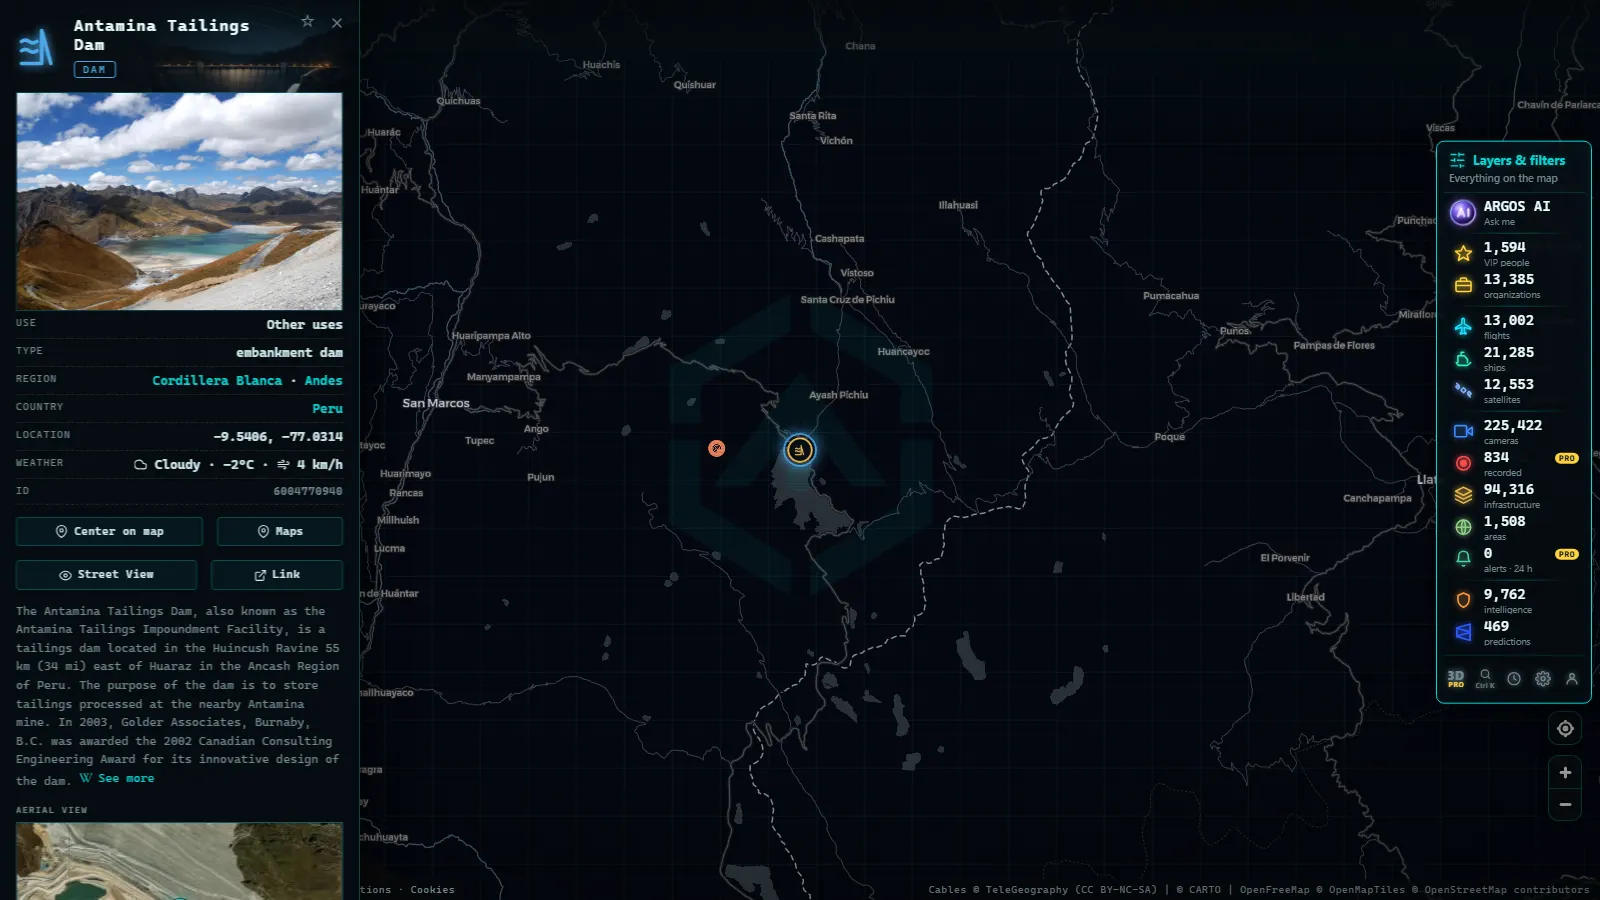
The Antamina tailings dam, in Áncash
Antamina is a copper and zinc operation in the Peruvian sierra, and the best documented part of it on public maps is not the pit: it is the tailings dam. In the dams layer it carries a structure type (embankment dam) and a use that is neither water supply nor power generation, which is the tell. A dam that holds residue is not a reservoir for a town.
These structures matter out of proportion to how little is said about them. They are the component of a mine that can fail catastrophically, their footprint grows every year the operation runs, and that growth is visible from orbit even when nothing else about the site is. The map gives you the location, the type and an identifier you can take to national registries. The global map of dams and reservoirs puts it in context with the rest.

The power that feeds the pit
In grid terms a large copper operation is a small city that never sleeps. Crushing and grinding rock runs around the clock, and in the Chilean case the water arrives desalinated from the coast and pumped uphill, which is itself a continuous electrical load. None of that can hide: generation, substations and the transmission corridors heading inland are all mapped.
So the power layer answers a question the mine will not. If you want to know what kind of operation you are looking at, follow the line back and see what is on the other end of it: thermal plants, hydro in the Peruvian sierra, or the solar and wind that northern Chile has been adding across the same desert. The country by country guide to South American power plants is the quickest way to tell which is which.
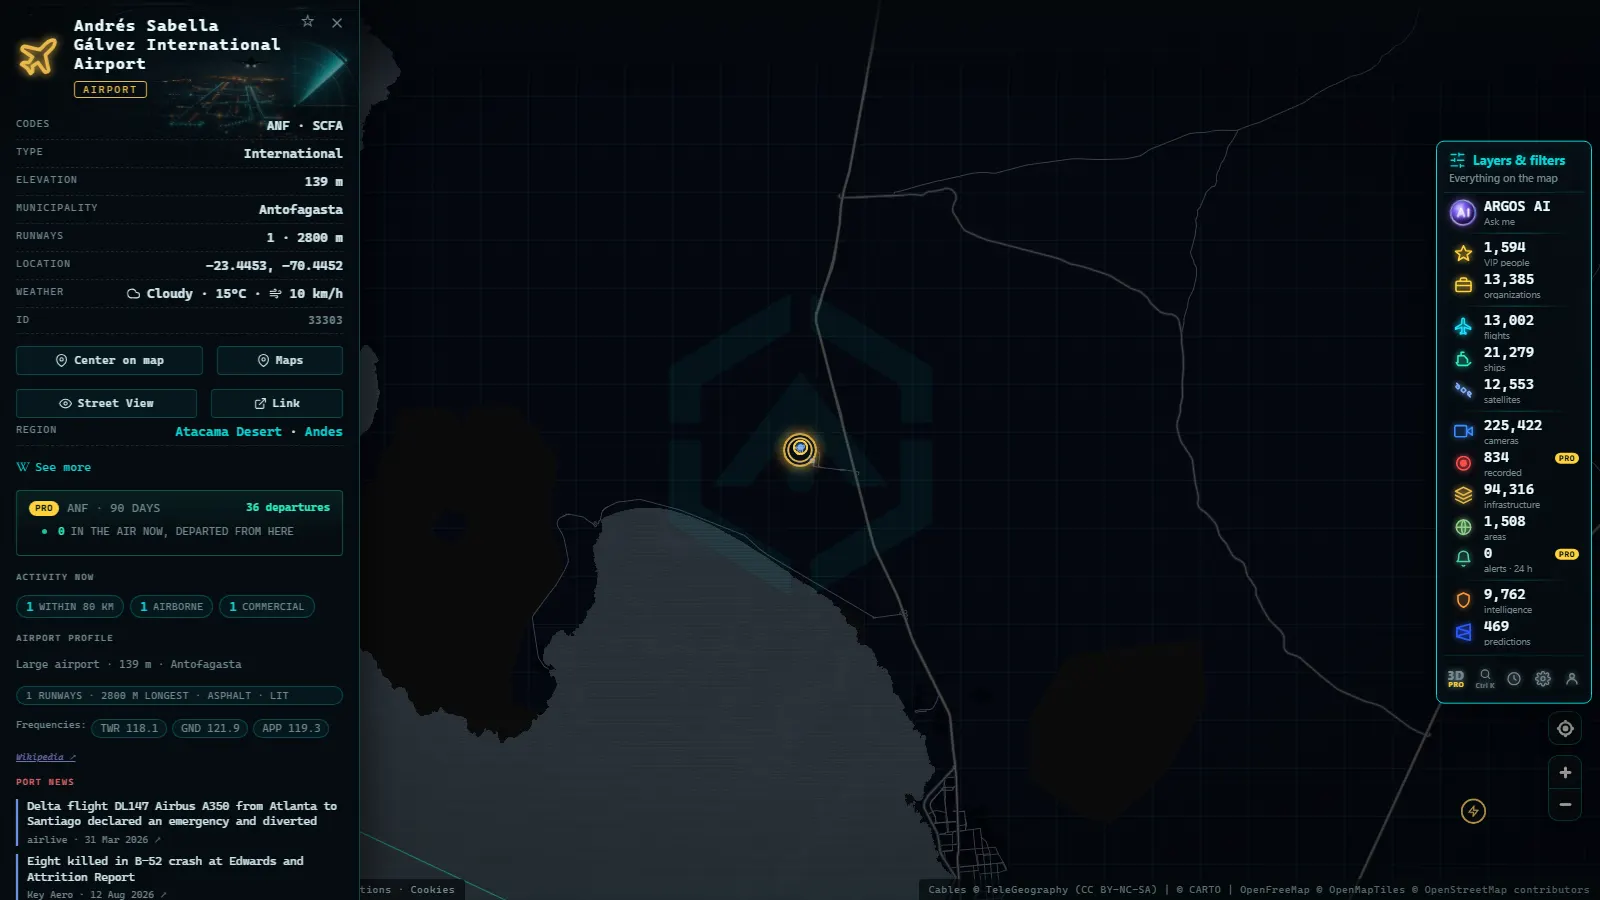
Antofagasta: where the copper leaves
Concentrate and cathodes from the Atacama go out through the northern Chilean coast, and Antofagasta is the terminal most people can name. On the map it is a port point with its berths, surrounded by live AIS traffic you can watch minute by minute.
The readable signal here is tempo. Bulk carriers sitting at anchor offshore rather than alongside suggest a queue; an empty roadstead suggests the opposite. It is crude, and it is honest about being crude: AIS tells you a vessel is anchored and what it declares as its destination, never what is in the hold or who it belongs to.
Copper is the backbone of the Chilean economy, which is why the country's macro numbers move with the metal:
Chile · GDP (nominal)
Chile · GDP growth
Build the copper mines Chile Peru map view yourself
You do not need a workflow, you need the right four layers on at once and the discipline to read each one for what it is good at. The table below is the whole method.
| Layer | What it shows near a mine | What to look for |
|---|---|---|
| Aviation (ADS-B) | The private airstrip and anything flying over it | Low, slow traffic clustered at shift hours, not airline routes |
| Dams | The tailings dam, with its type and use | A dam whose use is residue storage, not water or power |
| Power | Plants, substations and transmission corridors | Which generation the site is actually connected to |
| Ports and AIS | Loading terminals and the vessels around them | Bulk carriers at anchor instead of alongside |
| Cameras | Nothing at the mine, only the nearest public view | Weather and visibility over the desert, not the operation |
The points cited here
50 km
What you won't see
- Inside the pit. No camera, drone feed or sensor is published from any of these operations, and nothing here changes that.
- Ore grade, tonnage or production. Those are company figures on a company calendar. A public map counts entities, not tonnes.
- The truck fleet. Haul trucks carry no transponder a public receiver can hear. Vehicle movement inside the fence is invisible.
- The state of a tailings wall. The dam entry gives type and location. It says nothing about current height, freeboard, monitoring or stability.
- Who is on the shift plane. ADS-B carries an aircraft, not a manifest, and many corporate registrations are filtered from public feeds entirely.
- Continuous aviation coverage. Receiver gaps over the high desert mean tracks go estimated or disappear, and an absent aircraft is not evidence of an absent flight.
- People, faces or plates on any camera. Public cameras here are refreshed frames at low resolution, not video, and are not usable for identification.
The one live camera the Atacama gives you
The nearest useful public camera to this story is not at a mine at all. It is the 360 degree view from the Paranal observatory platform, high in the same desert, hours away by road from any copper operation. It was installed to watch the sky, not the ground.
It still earns its place at the top of this article, for one reason: it shows the conditions the mines work in. Dust, haze, cloud over the Atacama, the brutal clarity of the light, and at night an almost total darkness that explains why an observatory chose this spot. Treat it as the weather station of the region and it is genuinely informative. Treat it as a window onto mining and you will be disappointed, which is the point of saying so plainly.
Frequently asked questions
Can you see inside an open pit copper mine on a live map?
No. There is no public camera, feed or sensor pointing into the pit at La Escondida, Antamina or any other large copper operation. What is public is the infrastructure around it: the airstrip, the tailings dam, the power lines and the port. You infer activity from those edges, and you accept that the inference is coarse.
Is it free, live and usable without registering?
Yes, free and live, with no account. The aviation and AIS layers update continuously, the cameras refresh as frames rather than video, and the infrastructure layers (airports, dams, power, ports) are catalogues you can browse without signing in. Nothing in this article needs a login, a trial or a paid tier.
Which layers show La Escondida?
Three. The aviation layer holds the mine's own airstrip, one entry among 47,927 airports and airfields, plus any aircraft broadcasting over it. The power layer holds the plants and substations on the grid that feeds the site. The maritime layer holds Antofagasta and the vessels loading there. The pit itself has no layer.
Can you track ore trucks or daily production?
No. Haul trucks have no public transponder, the ore grade is a company figure released on the company's schedule, and nothing on a public map counts tonnes. The honest ceiling is presence and tempo: an airstrip receiving shift flights, a port with carriers at anchor, a grid connection drawing power. Everything beyond that is guesswork.
What does the Antamina tailings dam entry actually tell you?
Its location, its structure type (an embankment dam) and the fact that its use is storage of residue rather than water supply or power. That is enough to find it, to see how its footprint has grown in satellite imagery, and to look it up in national registries. It tells you nothing about wall height, freeboard or stability today.
- The World's Largest Ports and How to Watch Their Activity Live
- Submarine Cables: The Hidden Map That Holds the Internet Together
- Busiest Airports in Mexico: Track Live Flights Now
- Europe's Major Seaports: Rotterdam, Antwerp, Hamburg, Valencia, Algeciras and Piraeus
- Europe's Busiest Airports: Heathrow, Charles de Gaulle, Schiphol, Frankfurt, Istanbul and Madrid-Barajas
- Canada's Major Seaports: Vancouver, Prince Rupert, Montreal and Halifax