Blog · Critical infrastructure
Data Centers in South America: Caracas, Lima, Buenos Aires
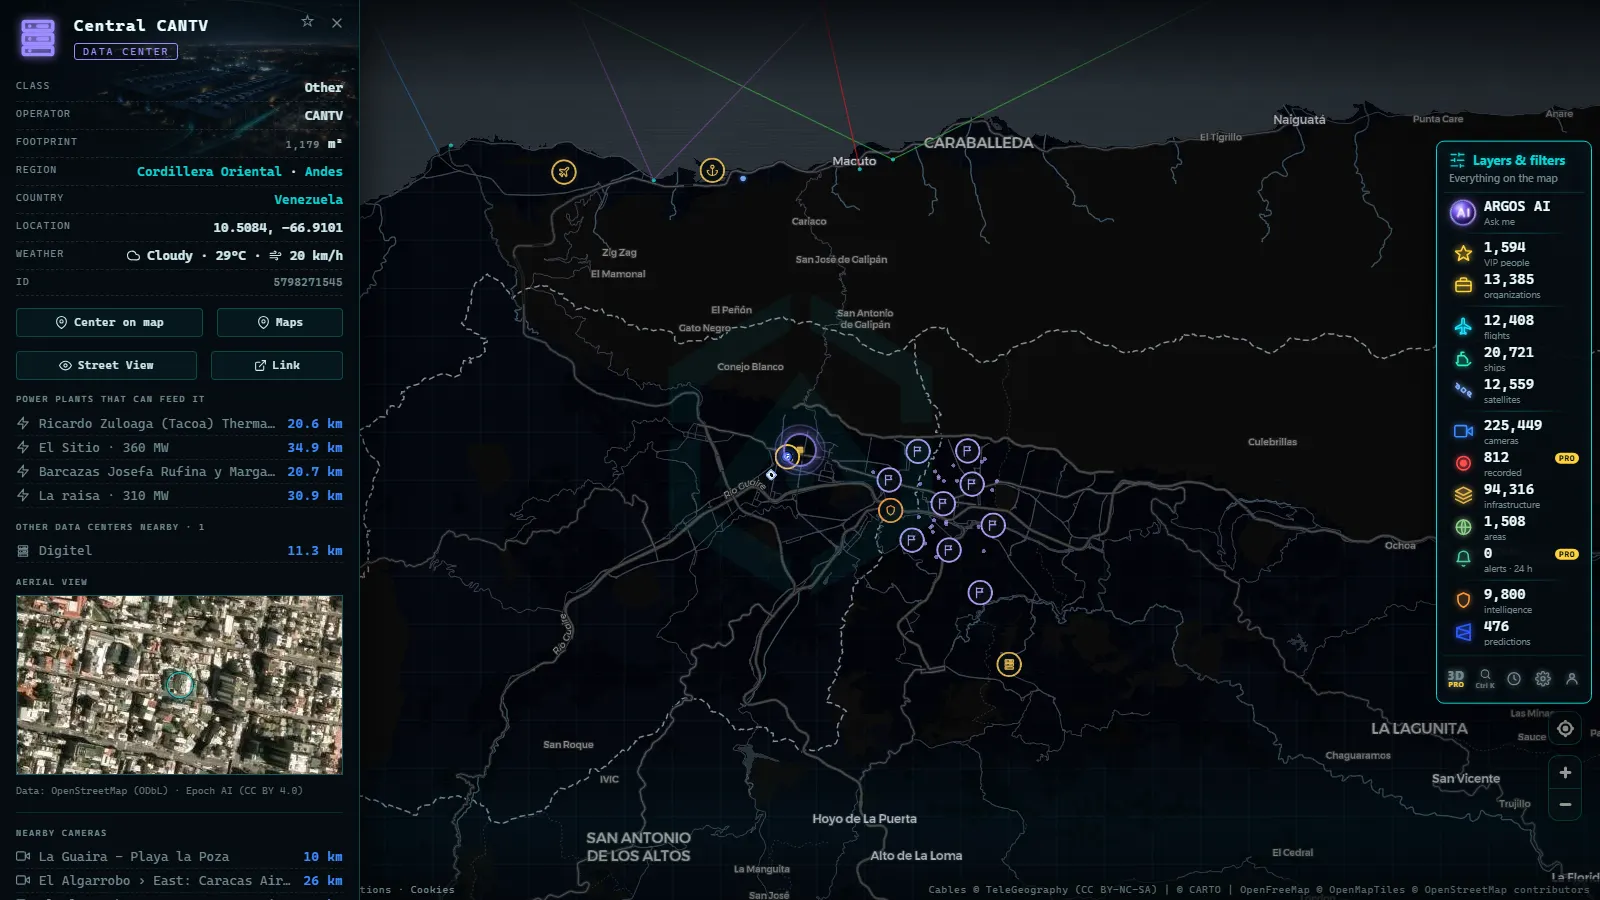
South America's data centers sit in a short list of coastal cities, and three of them you can open on a live map right now, free and without registering: Central CANTV in Caracas, Centro de Datos Win Santa Catalina in Lima and the Claro facility in Buenos Aires. ARGOS ATLAS maps 4,072 data centers worldwide with the operator and the class each record carries, and the South American ones sit a few kilometres from the port, the power station and the airport that explain why they are there at all.
That is the answer to what most people are actually asking: not how many exist, but which ones are real, who runs them and what you can see of each. This is the regional inventory, not the worldwide data center map and not the Mexican cluster of Querétaro and Monterrey, which already have their own pages.
The essentials, in 20 seconds
- 4,072 data centers are mapped worldwide, each with operator and class where the source record has one.
- Central CANTV (Caracas) is run by the state telecom CANTV and carries the largest mapped footprint of the three, about 1,179 m².
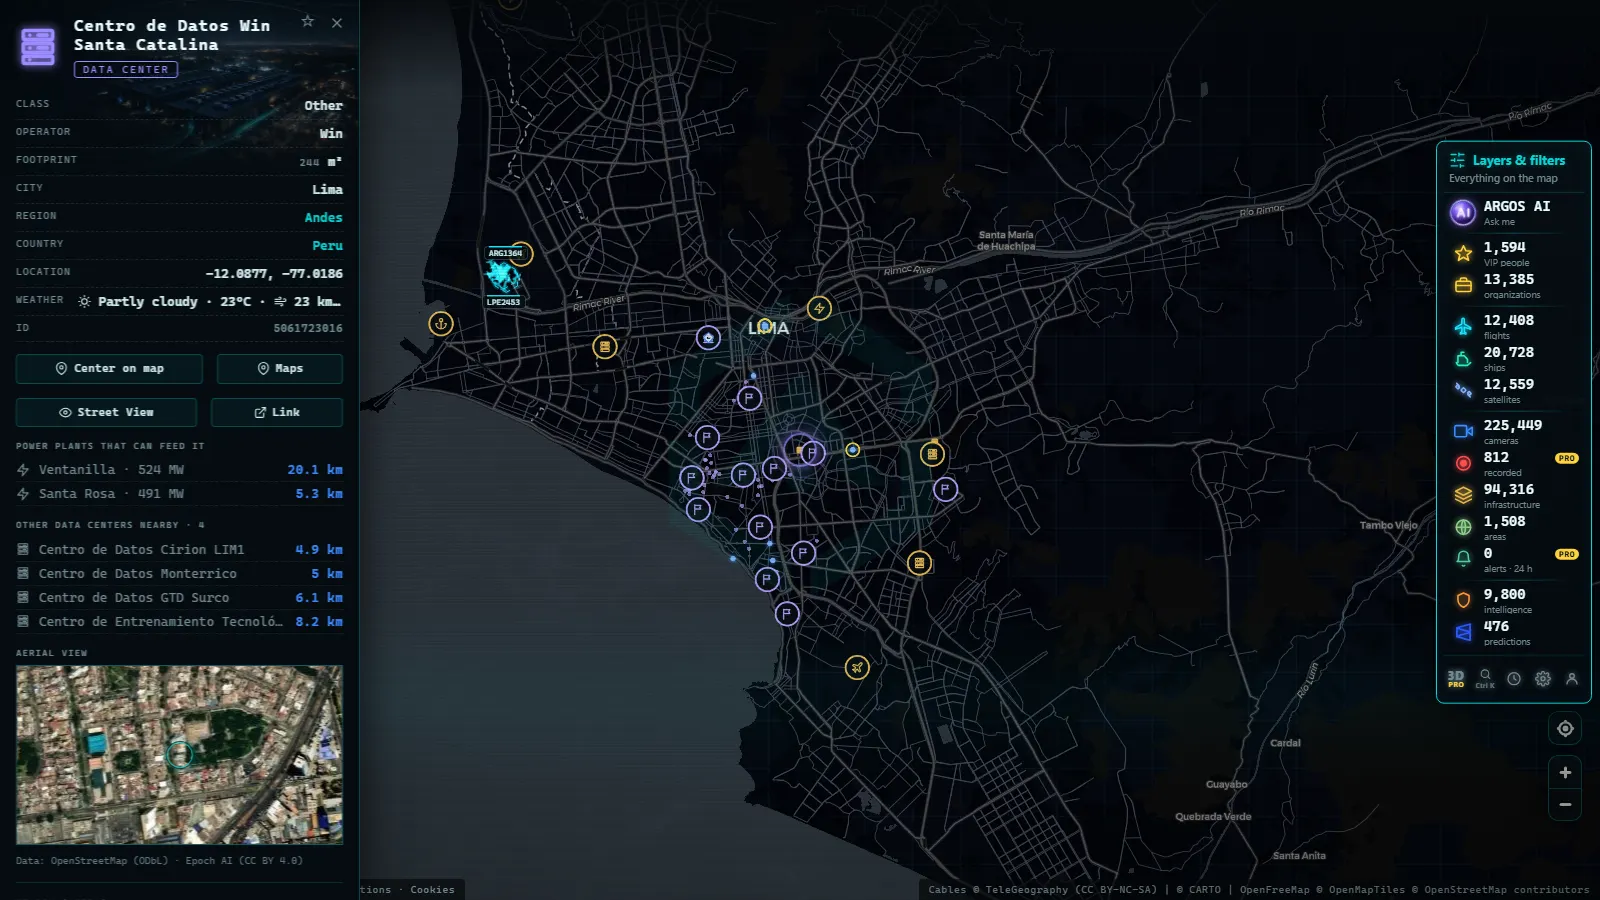
- Win Santa Catalina (Lima) belongs to the Peruvian operator Win, with a mapped footprint of about 244 m²: small, urban, carrier-driven.
- Cirion LIM1 (Lima) is the carrier-neutral option in the same city, operated by Cirion Technologies.
- Everything here is free and needs no account: open the map, click the pin, read the record.
Where the data centers in South America actually sit
Four metropolitan areas carry most of the regional weight: São Paulo by a wide margin, then Santiago de Chile, Buenos Aires and Bogotá. Lima and Caracas are second-tier nodes that matter enormously inside their own countries and barely register next to Brazil. The inland interior of the continent is close to empty, and that is not an accident of the dataset: it is the geography of the fibre.
What the map gives you is per-building, not per-country. Each pin carries an operator name, a class and, where the source has it, a footprint. Three of the Spanish-speaking sites people open most often are the ones in this article, and none of them had a page explaining what they are. Street-level context around two of them, from public traffic cameras:
Caracas: Central CANTV and a grid that argues with it
Central CANTV is the largest of the three by mapped footprint, roughly 1,179 m², and it is state infrastructure rather than a commercial colocation hall: the operator field reads CANTV, the national telecom. That single fact explains most of its behaviour. It exists to carry the country's backbone, not to sell racks to startups.
Two neighbours on the map matter more than the building itself. The first is the port of La Guaira, on the coast below the city, where the international cable comes ashore. The second is generation: the Ricardo Zuloaga (Tacoa) Thermal Power Plant Venezuela, a 1,720 MW gas plant that is one of the pillars of the Caracas supply. Venezuelan facilities live or die on grid stability, and a data center record tells you nothing about how many hours a year its diesel runs.
From the ARGOS ATLAS channel.
Lima: Win Santa Catalina, Cirion LIM1 and the Pacific landings
Lima shows the two business models side by side in one city. Win Santa Catalina, operator Win, is a compact urban site of about 244 m² in the Santa Catalina district: a domestic carrier's own room, close to its customers, not a wholesale hall. Small footprint, high relevance.
Cirion LIM1 is the other model. Cirion Technologies operates carrier-neutral capacity across Latin America, which means its value is the number of networks that meet inside it rather than the floor area. Both sit in a metro area whose freight and connectivity run through Callao, and whose international fibre lands on the Pacific shore south of the city. Lima is the clearest case in the region of a capital whose digital position is decided at the beach, not downtown.
Buenos Aires: Dock Sud, Claro and the Río de la Plata corridor
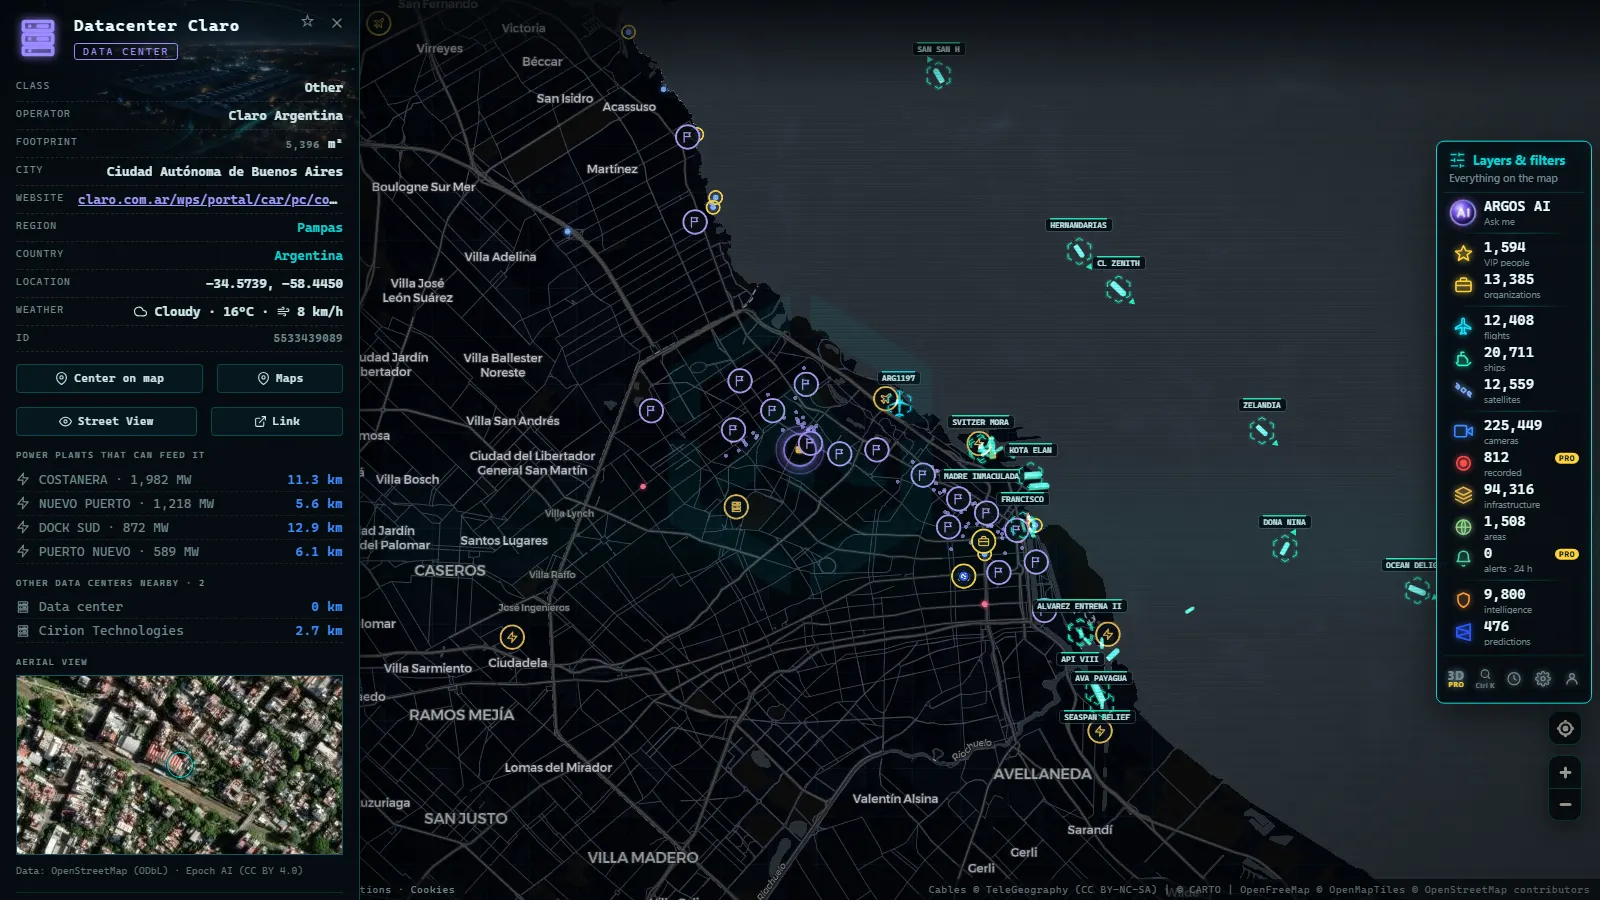
Buenos Aires works differently from the other two. The Claro facility serves a metro demand base of millions, and the Argentine market is fed as much by terrestrial links north to São Paulo as by its own landings, because the Río de la Plata is a river of mud, not a good beach for cable. The Buenos Aires port complex and the Dock Sud industrial belt mark the heavy-infrastructure side of the city, and that is where power, fibre and land availability overlap.
On the map, the useful move in Buenos Aires is not the data center pin on its own: it is the pin plus the traffic cameras around it. You will not see the building, but you will see the district, the road access and the traffic conditions of a corridor that matters for every delivery of equipment.
Why the subsea cable decides the address
Almost all intercontinental traffic in South America arrives through a small number of beach landings, and every kilometre of terrestrial fibre between that landing and a building adds latency, cost and one more segment that a backhoe can cut. That is why the regional map looks like a coastline with dots on it.
The consequence is counter-intuitive: a data center's quality depends less on the hall than on how many distinct cable systems it can reach without crossing a single-operator bottleneck. A site two hours inland on cheap land with cheap power may be unsellable, while a 244 m² room in central Lima is full. If you want the layer underneath all of this, the subsea cable map that holds internet together is the companion piece to this one.
Who operates data centers in South America: four kinds of owner
The operator field is the most informative thing in the record, because four very different owners show up. State telecoms such as CANTV run backbone infrastructure with public money and public politics attached. National carriers like Win or Claro build for their own subscriber base and sell leftover space. Regional neutrals, with Cirion Technologies as the clearest example, sell interconnection rather than floor area. And global hyperscalers are the newest layer, concentrated overwhelmingly in Brazil and Chile.
Knowing which of the four you are looking at tells you more than any size figure. A state backbone node and a neutral colocation hall of identical footprint are not the same kind of object, do not fail the same way and do not matter to the same people. The map labels the operator; the interpretation is yours.
The three cities side by side
| City | Facility and operator | What put it there | What to look for on the map |
|---|---|---|---|
| Caracas | Central CANTV, state telecom, ~1,179 m² | National backbone plus the La Guaira cable landing below the city | Check the Tacoa plant nearby: grid stability is the real risk here |
| Lima | Win Santa Catalina (Win) and Cirion LIM1 (Cirion Technologies) | Pacific cable landings and the Callao freight corridor | Two models in one city: domestic carrier room versus regional neutral |
| Buenos Aires | Claro facility and the Dock Sud industrial belt | Metro demand plus terrestrial links north to São Paulo | Use the nearby traffic cameras to read the district, not the building |
Los puntos citados
50 km
What you won't see
- No interiors. No racks, no customer lists, no power draw, no utilisation. The record stops at the shell.
- No capacity in megawatts. Footprint is what the source carries, and footprint is a weak proxy for how much compute is inside.
- No live camera on any of the three buildings. The cameras near them are public traffic cameras pointed at roads, which refresh as still frames rather than streaming video, and they go dark or useless at night.
- No people, no plates. Frames are too low in resolution to identify anyone, and nothing here is designed to.
- No completeness claim. Open records miss facilities, especially small carrier rooms and anything military or recently built. An empty area on the map means no record, not no data center.
Mapping data centers in South America in 30 seconds
Open the live map of global infrastructure, switch on the data center layer and zoom to the city you care about. Click a pin: operator, class and footprint appear in the side panel, and the port, power and airport layers around it give you the context that the pin alone does not. The search box takes facility names directly, so "CANTV" or "Cirion" gets you there faster than panning.
If what you want is the wider category rather than these three buildings, what counts as critical infrastructure and why it appears on public maps covers the reasoning behind publishing any of it. Everything described here is open on arrival: no account, no trial, no stored search history.
Frequently asked questions
Is the data center map of South America free?
Yes, and it needs no account. You open the map, switch on the data center layer and click any pin to read the operator, the class and the mapped footprint where the record has one. There is no trial, no email wall and no paywall on the infrastructure layer itself.
Which is the largest data center in South America?
The map cannot tell you. Records carry a mapped footprint, not power capacity in megawatts, and footprint is a poor proxy for size: a 244 m² carrier room in Lima may hold more traffic than a far larger shell. For a real ranking you need operator disclosures, not open map data.
Why are South American data centers almost all on the coast?
Because the subsea cable decides the address. Nearly all international traffic in the region arrives through a handful of beach landings, and every kilometre of terrestrial fibre between the landing and the building adds latency, cost and one more thing to cut. Caracas, Lima and Buenos Aires all sit near their landings.
Can I see inside a data center on the map?
No. You see the footprint, the operator name and the class the record carries, plus whatever public cameras happen to look at the surrounding streets. There are no interior views, no rack counts, no customer lists and no live traffic figures. Those are private, and open data will not supply them.
What is Central CANTV in Caracas?
It is the mapped facility of CANTV, the Venezuelan state telecom, and the largest footprint of the three sites in this article at roughly 1,179 m². It functions as national backbone infrastructure rather than a commercial colocation hall, which is why its record shows a state operator and no service class.
- Copper mines Chile Peru map: 4 live layers, and the blind spots
- What is critical infrastructure and why does it appear on public maps
- The World's Largest Ports and How to Watch Their Activity Live
- Busiest Airports in Mexico: Track Live Flights Now
- Europe's Major Seaports: Rotterdam, Antwerp, Hamburg, Valencia, Algeciras and Piraeus
- Europe's Busiest Airports: Heathrow, Charles de Gaulle, Schiphol, Frankfurt, Istanbul and Madrid-Barajas