Blog · Critical infrastructure
Data centers in Mexico: the 4 cities and what you can check
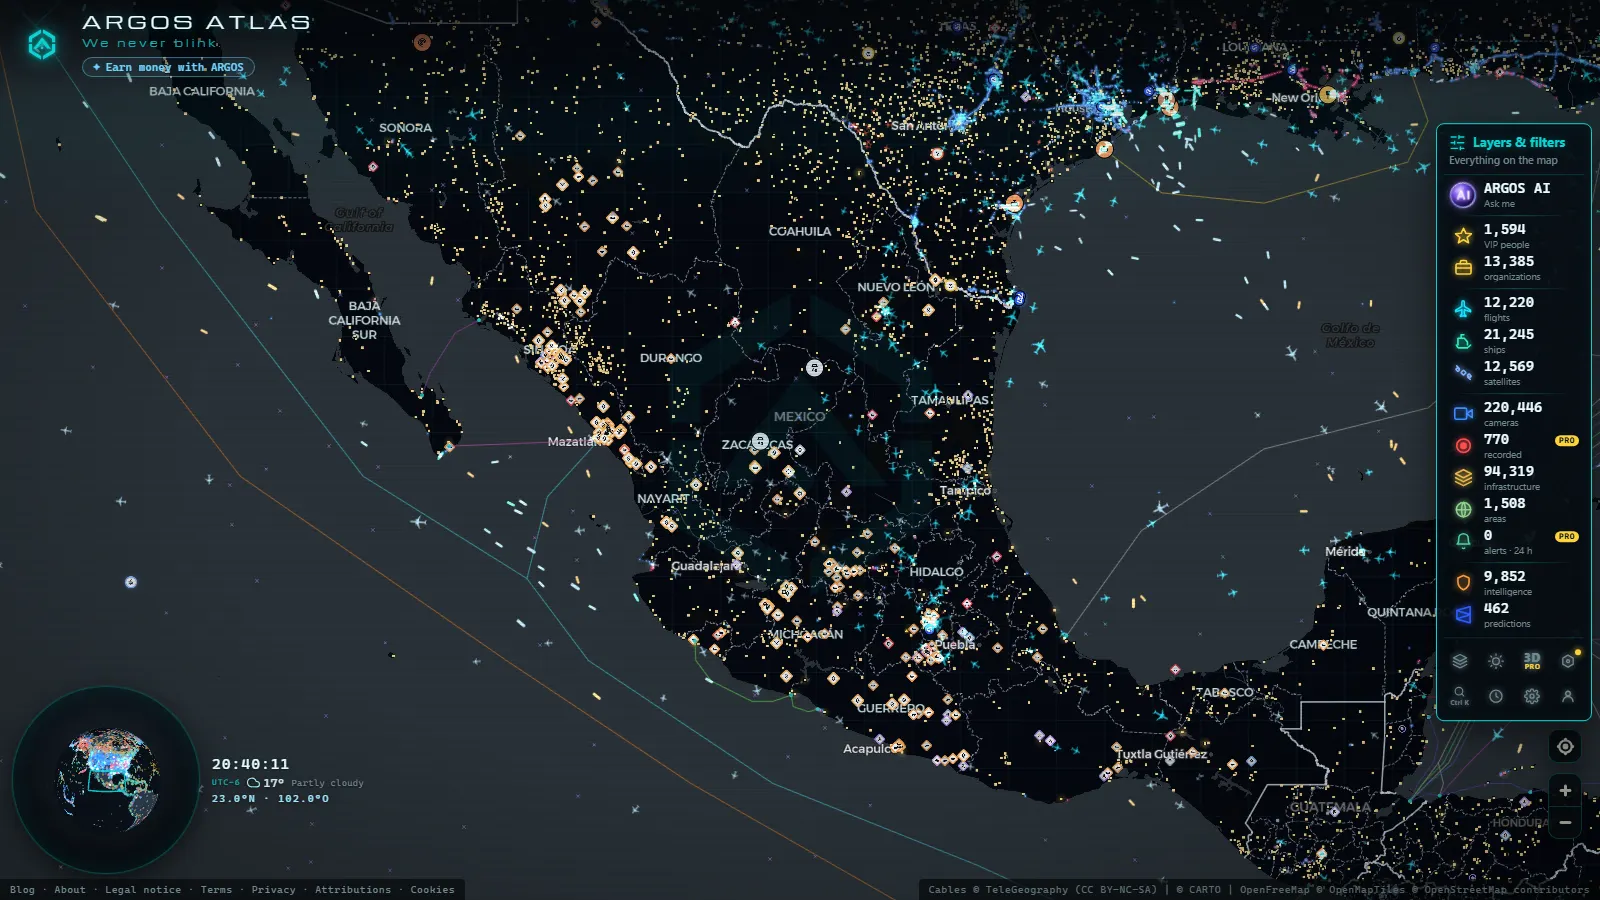
Mexico's data centers sit in four places, and all four are on the map right now: Querétaro, Monterrey, Guadalajara and León. Each hall is a point you can open, with the operator that open records name, the footprint the registry gives it and the infrastructure around it that explains the choice: the CFE gas plant in the same metro area, the airport the engineers fly into, the traffic camera on the road outside. Free, no account, nothing to install.
This is the Mexico cut of a global catalogue of 4,072 data centers, not a repeat of it. The world map of data centers and who is behind them answers how many exist and who owns them. This page answers the narrower question: which ones are here, why they are where they are, what you can confirm about each from outside, and the long list of things no map can confirm.
The essentials, in 20 seconds
- Querétaro is the centre of gravity: flat inland ground, low seismic risk and the trunk fibre between Mexico City and the Bajío.
- Monterrey runs on gas and proximity: CFE combined cycle plants such as Huinalá and Dulces Nombres sit in the same metro area, and Texas is a short drive north.
- Guadalajara arrived from electronics: decades of Jalisco manufacturing and a telecom backbone that predates the cloud.
- León is the newcomer: ECR8 León, operator MTP, is the Guanajuato entry in the catalogue.
- The map holds 4,072 data centers and 34,936 power facilities, so a hall and the plant that feeds it read on the same screen.
Why data centers in Mexico sit in four cities
Four things decide a site, and population is not one of them: a grid connection you can actually get, fibre that already passes the fence, ground that does not shake or flood, and users within a few milliseconds. Querétaro wins on the first three. Monterrey wins on generation and on being the nearshoring capital, with industrial gas supply running down from Texas. Guadalajara had the fibre and the engineers before anyone said cloud. León and the rest of the Bajío inherit the corridor that the other three created.
Mexico City is the odd one out. It has the demand and the carrier density, and almost none of the rest: subsidence, seismicity, water stress and land prices. That is why the halls that serve the capital keep stepping outward along the highway, which is the single clearest pattern on the Mexican infrastructure layer. International capacity arrives separately, on both coasts, through the submarine cables that carry internet traffic.
Mexico · Internet users
Mexico · GDP per capita
Querétaro: the corridor everyone names first
If you only remember one answer to the question of data centers in Mexico, it is Querétaro. The hyperscale cloud regions announced for the country point at this state, and so do most of the big colocation names (KIO, Odata, Ascenty, Scala, CloudHQ, Equinix). The reason is unglamorous: cheap flat land along the Mexico City highway, a grid corridor that was built for manufacturing, and a seismic profile that insurers like.
Two cautions belong here, because this is where most published numbers go wrong. First, announced is not running: a region announcement, a land purchase and an energised hall are three different events, and a map point cannot tell you which one you are looking at. Second, the state and the city are not the same thing, and several sites commonly called Querétaro sit in neighbouring municipalities. Open the point and read the location field instead of trusting the name.
From the ARGOS ATLAS channel.
Monterrey: the one that starts with electricity
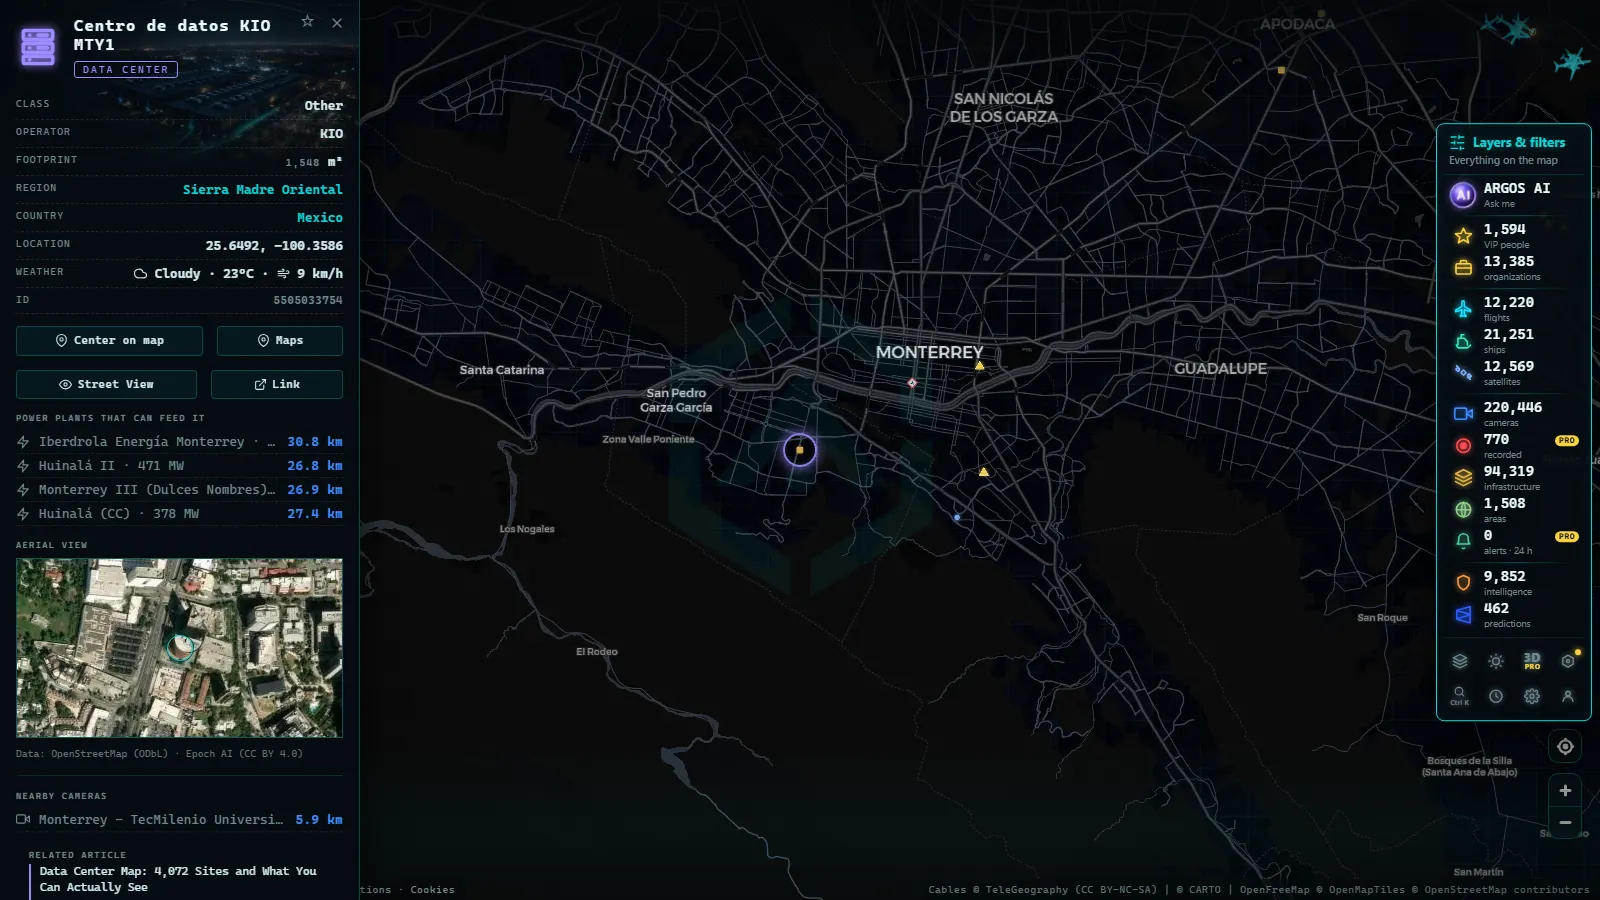
Monterrey is the clearest case of infrastructure deciding geography. The halls here are surrounded by gas fired generation in the same metropolitan area, which is exactly what a hall shopping for tens of megawatts wants to be near.
The operator on that card is KIO, one of the Mexican colocation players, and the footprint is the registry's, not a marketing figure. Now put the generation beside it:
Huinalá II is a gas plant operated by CFE, and Monterrey III (Dulces Nombres) is a second one in the same basin. Together with the grid they feed, they are the reason Nuevo León can absorb industrial load. The other half of the story is logistics: Monterrey International Airport connects the metro to Texas in a morning, which matters more than it sounds for maintenance contracts and for the ranking of Mexico's largest airports.
Guadalajara: electronics first, cloud second
Guadalajara did not become a data center city because someone drew a corridor. Jalisco has assembled electronics for decades, which left behind three things a hall needs: carrier routes into the metro, a local pool of engineers, and industrial parks already zoned and powered. The cloud arrived into an existing supply chain.
What that means practically is that Guadalajara sites skew toward enterprise colocation and regional edge rather than the single enormous campus. On the map the giveaway is the neighbours: open a point here and you are as likely to find a factory, a logistics park and Guadalajara International Airport in the frame as another hall. The lakeside towns south of the city, around Ajijic and Lake Chapala, are in the same traffic basin and are where several public cameras actually sit, which is useful when you want to see weather and road conditions near the metro rather than inside it.
León and the Bajío: the newest entry
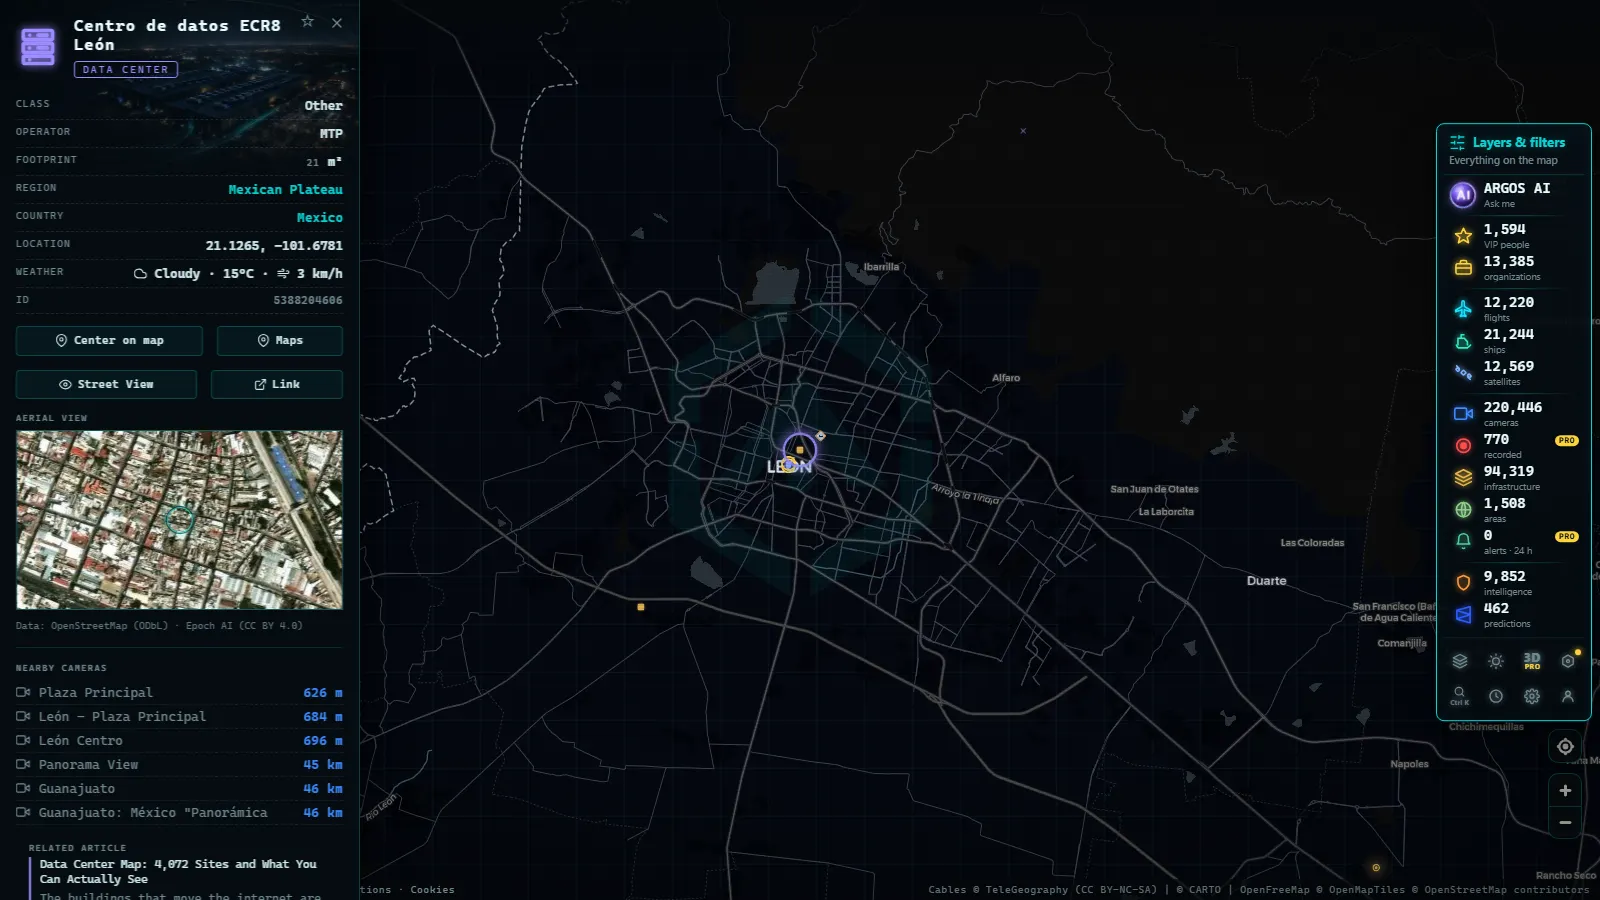
León, in Guanajuato, is the youngest of the four and the one with the least published about it. The catalogue has it:
Operator MTP, with a footprint far smaller than the Monterrey or Querétaro sites. That size is the point, not a flaw: the Bajío pattern is edge and regional capacity serving automotive and leather manufacturing clusters, not hyperscale. Guanajuato, Aguascalientes and Querétaro form one industrial band, and capacity placed in León is capacity placed close to factories that cannot tolerate a round trip to the capital. Expect this tier of site to multiply faster than the big campuses, and expect it to be worse documented, because small colocation does not issue press releases.
What you can verify about data centers in Mexico from outside
The honest division is between what geography makes observable and what only a company can tell you. A footprint, a neighbour and a grid are observable. A tenant list is not.
| City (state) | What the map pins | What it tells you | What to check first |
|---|---|---|---|
| Querétaro | Several halls plus announced campuses | Where the national cluster is | Read the location field: the name says Querétaro, the point may be another municipality |
| Monterrey (Nuevo León) | KIO MTY1, CFE gas plants, the airport | Power came before the halls | Open Huinalá II and Dulces Nombres to see the generation in the same basin |
| Guadalajara (Jalisco) | Enterprise sites inside industrial parks | Electronics history, not a new corridor | Look at the neighbours in the frame, factories and the airport |
| León (Guanajuato) | ECR8 León, operator MTP | Small regional capacity for the Bajío | Compare its footprint with the Monterrey site to see the tier difference |
Reading a card is the whole technique: Equinix MO1 gives you an operator, a class and a surface area, and nothing it does not actually know. That restraint is the useful part, and it is the same logic behind what counts as critical infrastructure on public maps.
The cameras on the roads outside
You cannot see a hall from inside, but you can often see the road that serves it. The catalogue holds 220,446 public cameras (count as of October 2026), and the Mexican ones are traffic and weather cameras run by public bodies, pointed at highways and junctions.
Useful for weather, flooding, visibility and whether an access road is moving. Useless for anything about the building itself. The densest Mexican coverage is in the capital, and the traffic cameras of Ciudad de México are the place to start if roads rather than racks are what you came for.
What you won't see
- No interior of any data center. No racks, no corridors, no badge readers, no cameras inside the fence. Ever.
- No live power draw and no real capacity. Installed megawatts, occupancy and redundancy tier are commercial claims, not measurements.
- No tenant list. Which cloud or bank sits in which hall is not in open records, and guessing it from a building is not verification.
- Cameras are still frames, not video, they refresh on their own schedule, and many Mexican feeds go dark or useless at night.
- Announced is not built. A planned campus and an energised one look identical from above.
- No personal detail. Frames are too coarse for faces or plates, and nothing here is for identifying people or vehicles.
How to find data centers in Mexico on the map
Open the live infrastructure map, zoom to the band between Mexico City, Querétaro and León, and turn on the data centers family. Points carry the operator and footprint from the catalogue. Then add the power layer in the same view: in Monterrey the halls and the gas plants land on top of each other, which is the fastest way to understand the siting logic without reading a single press release. Finish in Guadalajara and León to see the smaller tier, then compare what the cards actually claim against what any operator claims publicly. The gap between those two is the real subject of this page.
Frequently asked questions
Where are most data centers in Mexico?
In Querétaro, which has become the country's main cluster, followed by Monterrey, Guadalajara and, more recently, León. The pattern is inland and industrial: flat ground, low seismic risk, trunk fibre already passing and a grid connection that can actually be obtained. Mexico City generates the demand, but the halls serving it keep moving outward.
Is the map free, live and usable without an account?
Yes. It opens free, with no signup and nothing to install. Flights and ships move in near real time, public cameras refresh as still frames, and the data center, power and airport layers come from a catalogue that is updated rather than streamed. Nothing on the data center layer is a live video feed.
Can I see inside a data center on the map?
No. You see an exterior footprint, the operator that open records name and the surrounding infrastructure. There are no cameras inside any hall, no rack layouts, no customer lists and no live power draw. Everything about what runs in there comes from company statements, not from anything observable on a map.
Why do operators pick Querétaro and Monterrey over Mexico City?
Because of power, land and risk. Querétaro offers inland ground with low seismic exposure and fibre between the capital and the Bajío. Monterrey offers industrial gas generation in the same metro area and a short run to Texas. Mexico City has the users but also subsidence, seismicity, water pressure and land costs.
Can I verify a data center's real capacity from open sources?
Not reliably. Footprint is observable, and so is the grid and gas plant nearby. Installed megawatts, occupancy, redundancy tier and which cloud sits in which hall are commercial claims. Treat announced projects as announcements: a press release and a finished building are very different things, and the map cannot tell them apart.
- Data Centers in South America: Caracas, Lima, Buenos Aires
- Copper mines Chile Peru map: 4 live layers, and the blind spots
- What is critical infrastructure and why does it appear on public maps
- The World's Largest Ports and How to Watch Their Activity Live
- Submarine Cables: The Hidden Map That Holds the Internet Together
- Busiest Airports in Mexico: Track Live Flights Now