Blog · Critical infrastructure
Data Center Map: 4,072 Sites and What You Can Actually See
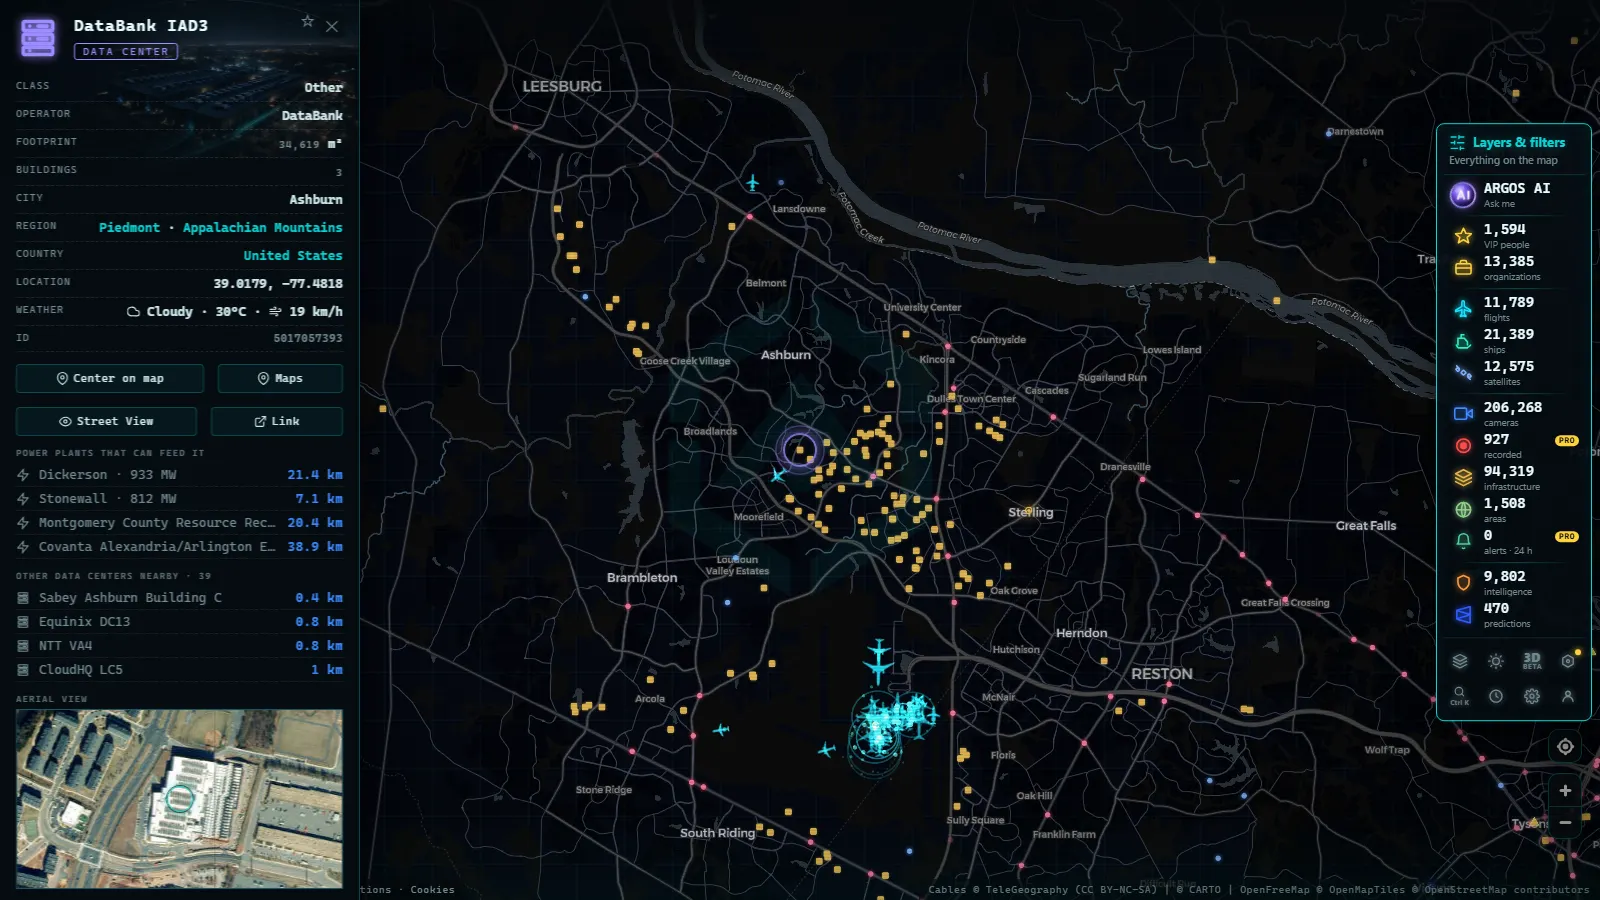
Open the live data center map and you get 4,072 data centers plotted worldwide, each one a card with the operator's name, the class of site and, where the record has it, the building's floor area. It is free, there is no sign-up, and the halls sit on the same canvas as the power plants, ports and airports around them. That mix is the point: a data center only matters because of the substation next door and the fibre under the road.
What you will not get is a live picture of any of it. Data centers are the least photographed piece of critical infrastructure on the planet, and that is deliberate. This guide covers where the dense clusters are, how to read an entry, which operators actually carry traffic in Latin America, and which nearby cameras are the closest thing to a view.
The essentials, in 20 seconds
- 4,072 data centers are mapped worldwide, each with operator, class and, where known, floor area.
- Ashburn, Virginia is the densest corner of the map: DataBank IAD3, NTT VA4 and Sabey Ashburn Building C sit minutes apart.
- 34,936 power facilities share the same map, and the substation beside a hall tells you more than the hall does.
- No public camera points at a data center anywhere: nearby street and port cameras are the closest available view.
- Free, live and without registration, next to the 206,268 traffic cameras already on the map (count as of September 2026).
What a data center actually looks like from the outside
A grey shed with no sign on it. That is the honest answer, and it is why these buildings are so hard to recognise from the street. The tells sit around the edges: a private substation with its own transformers, a fenced bank of diesel generators, rows of chillers or dry coolers along the roofline, almost no windows, a car park far too small for the floor area, and a loading dock built for pallets rather than people. Security is discreet but layered, with bollards, a gatehouse and cameras that point outward.
Operators rarely put a logo on the facade. DataBank, NTT and Sabey all run buildings in the same Virginia county that a passer-by would read as warehousing. If you want to know what is inside, the map entry is more useful than the view, which is the reverse of how critical infrastructure on public maps normally behaves.
Ashburn, Virginia: the densest data center map in the world
Loudoun County, and the town of Ashburn inside it, is the thickest cluster on any data center map. The reason is historical rather than geographic: the region's first big internet exchange landed here, cheap land and cheap power followed, and every network that needed to be near every other network piled in. Traffic between two users on the US east coast has a good chance of crossing a building a short drive from Washington Dulles International Airport, whose IATA code IAD is still the naming convention operators use for their halls.
Two entries show the pattern. DataBank IAD3 is a colocation site named straight after the airport code, where many tenants share one building. NTT VA4 belongs to a global carrier that builds its own campuses instead of renting space, and numbers them by state.
From the ARGOS ATLAS channel.
How to read a data center map entry
Every entry carries the same four things: the name as the operator registers it, the operator itself, a class, and a floor area where a reliable source exists. The name matters more than it looks. Searching for the exact string the operator uses (Sabey Ashburn Building C, not "Sabey Ashburn") is what makes the card findable, and it is how you recognise the site when you arrive at the map.
| Entry | Operator | What the card gives you | What to look for |
|---|---|---|---|
| DataBank IAD3 | DataBank | Colocation site, floor area | Multiple tenants, so traffic is mixed |
| NTT VA4 | NTT | Carrier-built campus | Numbered siblings nearby on the same map |
| Sabey Ashburn Building C | Sabey Data Centers | One building of a lettered campus | The other letters, usually within metres |
| Possum Point | Virginia Electric & Power | Oil-fired generating plant | Who feeds the Virginia cluster |
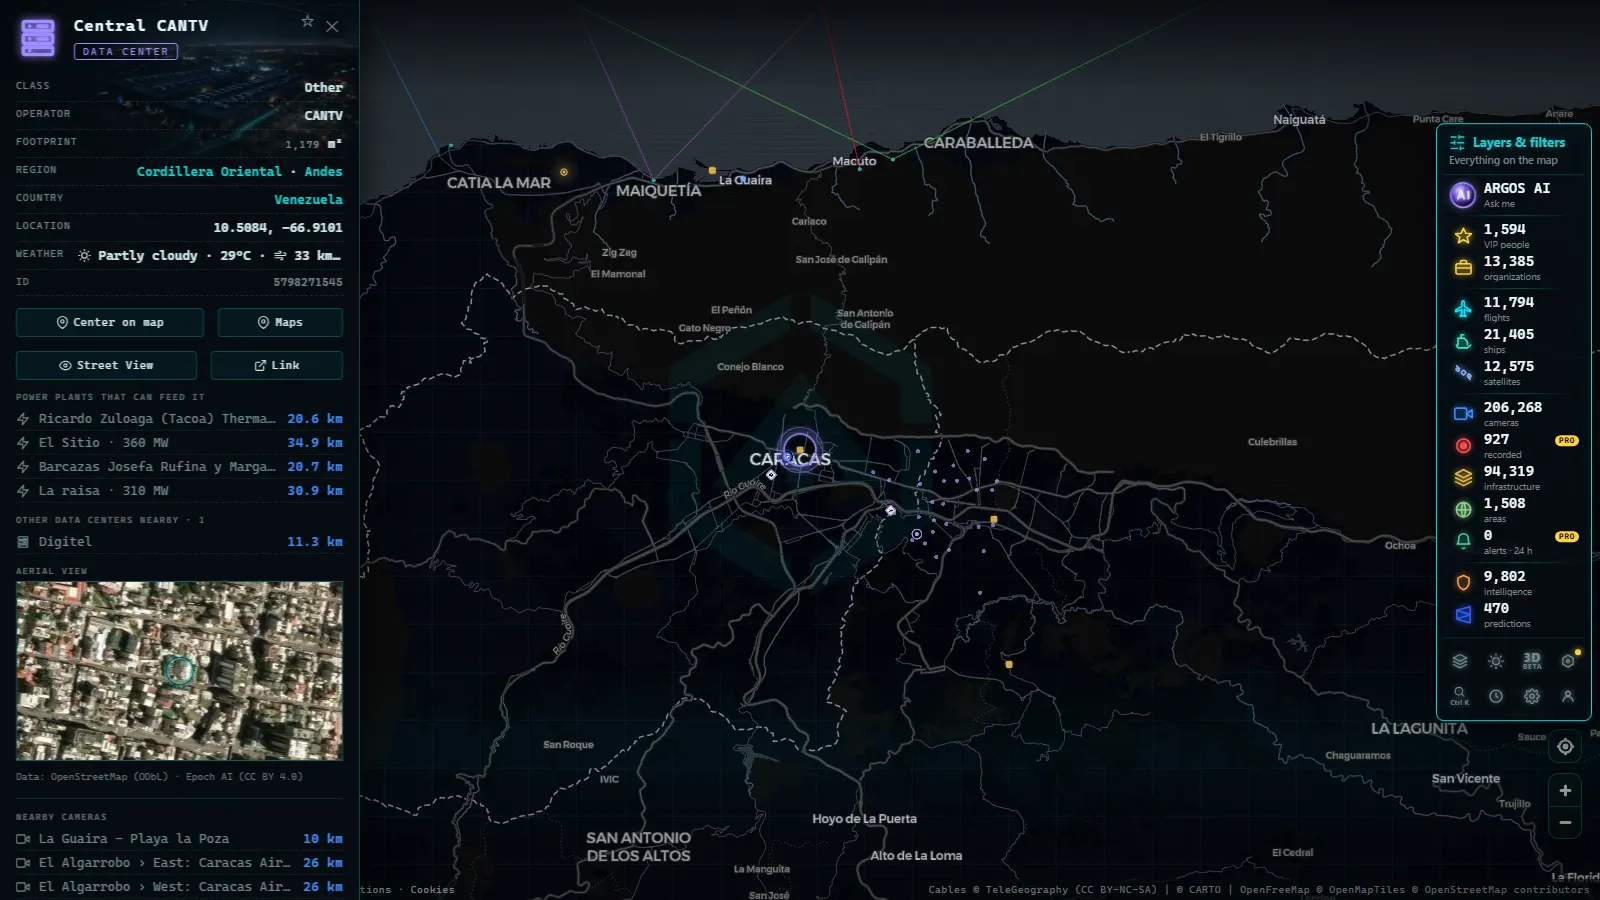
| Ricardo Zuloaga (Tacoa) | Government operator | Gas-fired plant near Caracas | The grid behind Venezuelan hosting |
Power is the tell
The quickest way to judge a data center cluster is to turn on the power layer, which carries 34,936 facilities. A hall is just a box until you see what feeds it. In Virginia, Possum Point is the kind of entry worth opening: an oil-fired plant run by Virginia Electric & Power, sitting in the same utility territory that the Ashburn campuses draw from. Its card gives capacity and fuel, which is as close to a load story as public data gets.
What the map will not do is tell you how many megawatts a specific building consumes. Operators do not publish that, and an estimate dressed up as a measurement is worse than an honest blank. So the technique is indirect: look at the generation and the substations around a cluster, and at how many halls share them.
Latin America: the operators that carry the traffic
In much of Latin America the useful entry is not a hyperscaler's campus but a national carrier's exchange building, a telephone exchange that grew racks. That is why the operator field matters more here than the class: the same grey box can be a colocation provider, an incumbent telco or a bank's own facility, and only the name separates them.
Caracas is a clean example of reading by surroundings. The Ricardo Zuloaga (Tacoa) Thermal Power Plant Venezuela is a gas-fired plant on the coast feeding the metropolitan grid, and the road cameras toward the airport, like El Algarrobo › North, are the only live imagery in the area. Pair that with the corporate headquarters layer and you can usually work out who owns what, which is the normal method when signage gives you nothing.
Buenos Aires, Dock Sud and where the cables come ashore
A data center map stops making sense the moment you forget the sea. International capacity arrives by submarine cable, and in Argentina that means the Río de la Plata coastline near Buenos Aires, where the landing stations sit close to the port estate. The map carries 1,081 ports, and the one at Dock Sud is the industrial half of the estuary, with tanker berths, container traffic and the cable corridors running behind them.
The camera shows the dock, not a landing station, and that gap is the honest summary of this whole subject. For the cable side of it, the guide to the submarine cables that hold up the internet covers the routes themselves.
The two Buenos Aires cameras
50 km
Cameras near data centers, and why there are so few
There are 206,268 public cameras on the map (count as of September 2026), overwhelmingly run by road authorities, ports and weather networks, and not one of them is aimed at a data hall. Road operators publish cameras to show congestion. Ports publish them to show berths. Nobody publishes a camera to show a building whose entire security model depends on being boring.
So the realistic use is contextual. A motorway camera on the approach to Ashburn tells you the weather and the traffic on the service roads. A port camera at Dock Sud tells you what is moving where the cables come ashore. Both are useful for timing a visit or checking conditions, and neither is surveillance of the facility itself.
What you won't see
- No camera on any data center. Not a single one of the public feeds points at a hall, a generator yard or a gate.
- Still frames, not video. Public cameras publish periodic images, refreshed on the operator's schedule, and many go dark or useless after sunset.
- No people, no plates. The resolution and the framing do not identify individuals or vehicles, and we do not publish anything that would.
- No power consumption per site. Operators keep it private and we do not invent a number to fill the field.
- No tenant lists. The map names the operator of the building, never who rents racks inside it.
- Uneven coverage. Entries are densest where registries and planning records are open, and thinnest where they are not.
Using the data center map in five minutes
- Open the map of data centers and infrastructure and switch on the data center family in the side rail.
- Zoom to Ashburn first. The cluster density there is the calibration shot for every other region you look at.
- Open one card, read the operator, then search that operator's name to find its siblings. Campuses are lettered or numbered for a reason.
- Turn on the power layer and look for the nearest generating plant or substation. That is the constraint everything else is built around.
- Add the camera layer last, and treat whatever appears as weather and traffic context for the area, not as a view of the site.
Do that once and the geography stops looking random. Capacity lands where the fibre already is, where the grid has headroom, and where someone got there first.
Frequently asked questions
Is the data center map free and live?
Yes. The map is free, needs no account and no registration, and it loads 4,072 data center entries alongside live layers for flights, ships and 206,268 public cameras (count as of September 2026). The data center records themselves are static locations, not live feeds, so what refreshes around them is the traffic, not the buildings.
Can I watch a data center on a public camera?
No. There is no public camera pointed at a data hall anywhere on the map, and there almost certainly never will be: operators treat sightlines as a security control. What you can open is a nearby street, port or airport camera, which shows the access roads and the weather over the site, not the building itself.
Why are so many data centers in Ashburn, Virginia?
Because the region's first major internet exchange landed there and everything else followed. Once enough networks were in one county, the cost of not being there outweighed cheaper land elsewhere. Add inexpensive power, flat buildable parcels and proximity to Washington Dulles, and operators like DataBank, NTT and Sabey all built within minutes of each other.
How do I tell a data center from an ordinary warehouse?
Look at the edges, not the building. A private substation with its own transformers, a fenced row of diesel generators, chillers across the roofline, almost no windows and a car park far too small for the floor area are the reliable tells. Warehouses have truck bays and people; data centers have electrical plant and nobody.
Does the map show how much power each data center uses?
No. Site level consumption is not published by operators and we do not estimate it, because a guessed megawatt figure is worse than none. What the map does give you is the power layer itself, with 34,936 facilities, so you can see which generating plants and substations sit near a cluster.
- South America Airports Live Map: Bogotá, Lima, Buenos Aires
- Data centers in Mexico: the 4 cities and what you can check
- Data Centers in South America: Caracas, Lima, Buenos Aires
- Copper mines Chile Peru map: 4 live layers, and the blind spots
- The World's Largest Ports and How to Watch Their Activity Live
- Busiest Airports in Mexico: Track Live Flights Now