Blog · Urban mobility
How Traffic Is Measured: Inductive Loops, Cameras, Bluetooth, and Floating Car Data
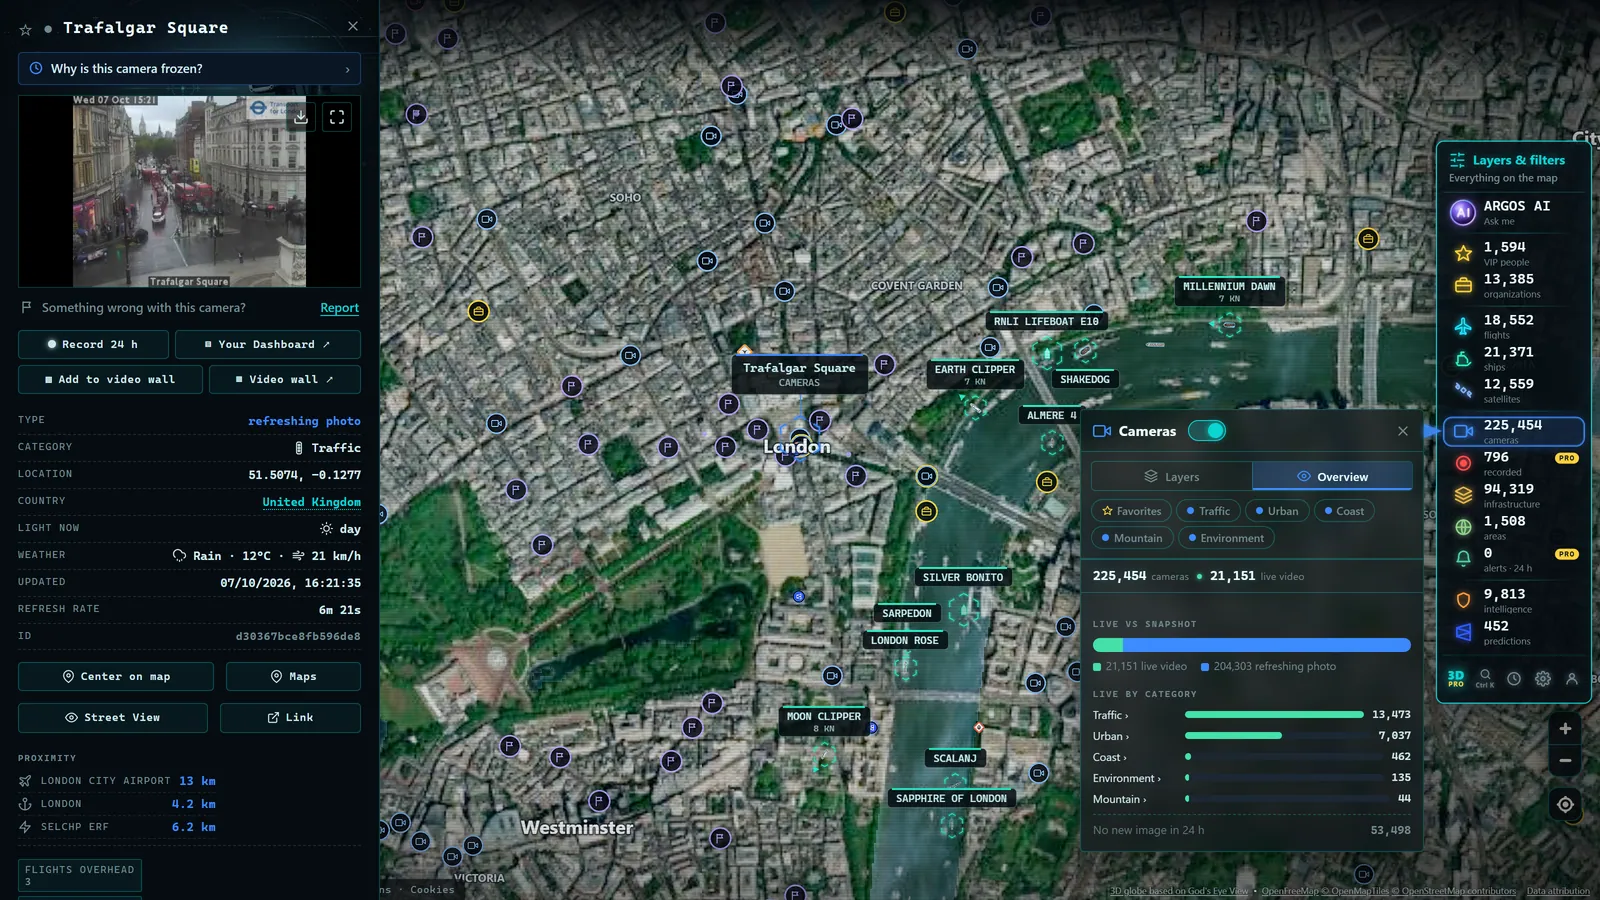
You open the map before leaving home, see the avenue shaded red, and change your route without a second thought. But have you ever stopped to wonder how traffic is measured so that color appears there in the first place? How does the map know there is a jam if nobody called to report it? The answer is a surprisingly varied ecosystem of traffic sensors: cables buried under the asphalt, cameras that count vehicles using computer vision, antennas that detect your Bluetooth as you drive past, and above all, millions of phones quietly reporting their position without their owners giving it much thought. Let us open the hood on real-time traffic data.
The core question: how does the map know there is a jam?
When a map shades a segment red, it is making a specific claim: that vehicles are moving through that stretch considerably slower than usual. To support that claim, it needs to measure two fundamental quantities, how many vehicles are passing (traffic volume) and how fast they are moving (speed). Every traffic measurement technology, from the oldest to the most modern, is designed to capture one or both of those values.
The differences between methods come down to where they measure and how. Some observe a fixed point on the road with great precision; others track flow across entire segments with less detail but near-total coverage. The sophistication of today's systems lies in the fact that these approaches do not compete, they complement each other.
Inductive loop detectors: the veteran technology beneath the road
If you have ever noticed rectangular cuts sealed with dark compound in a traffic lane (just before a signal or in the middle of a highway) you have seen an inductive loop detector. It is a loop of wire buried a few centimetres beneath the asphalt, carrying an electrical current. When the metallic mass of a vehicle passes over it, the electromagnetic field is disturbed, and that disturbance is logged.
From that simple principle, inductive loops do three things well:
- Count every vehicle that passes, with high reliability.
- Measure speed, by placing two loops a known distance apart and timing the gap between detections.
- Classify by length, distinguishing cars from trucks based on how long the metallic mass remains over the loop.
Inductive loops have been the backbone of traffic measurement networks for decades. They are the standard technology behind the vehicle detectors embedded in pavement across US interstates, UK motorways, French autoroutes, and highways worldwide. Their weaknesses are equally well known: installation and repair require closing lanes and cutting the asphalt, and they only see what passes directly over them. They measure a point, not a stretch.
Cameras with computer vision: counting without touching the road
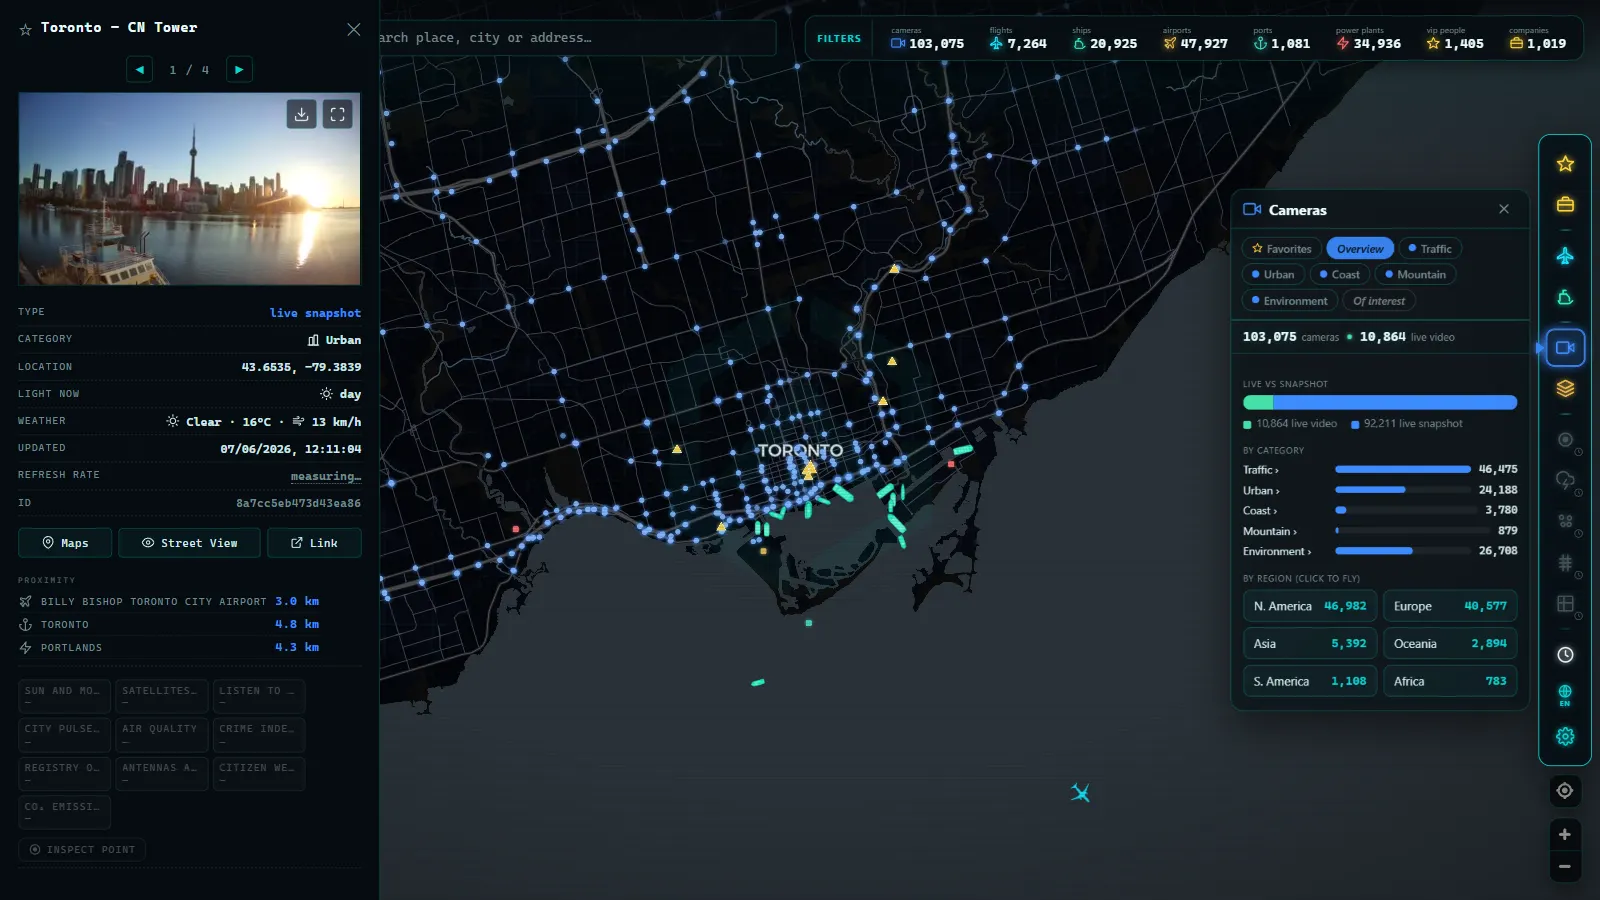
The fastest-growing alternative is cameras equipped with computer vision. Mounted on gantries and poles, they analyze the video stream in real time to detect vehicles, count them, estimate their speed, and classify them by type, all without touching the road. For highway operators, the operational advantage is clear: installation and maintenance require no lane closures, and a single camera can cover multiple lanes simultaneously.
Alongside cameras, radar and lidar sensors serve as pure measurement devices (distinct from enforcement radars, these are traffic census instruments). They emit radio waves or laser pulses and infer presence and speed from the return signal. Both technologies perform reliably at night and in rain, conditions where optical computer vision can struggle.
Cameras also have a role that goes beyond producing numbers, one we will return to shortly.
From the ARGOS ATLAS channel.
Bluetooth and Wi-Fi sensors: measuring actual journey time
There is one quantity that neither an inductive loop nor a camera captures well: how long it actually takes to travel from point A to point B. That is where Bluetooth and Wi-Fi sensors come in. Small devices installed at multiple points along a route detect the identifiers broadcast by passing vehicles (a hands-free kit, an in-dash navigator, a phone) and re-identify the same device when it crosses the next sensor downstream.
If your device passed sensor A at 8:00 and sensor B at 8:12, the system knows that segment took twelve minutes. Aggregated across thousands of trips, this produces the real journey time for the segment, the basis of the overhead signs on motorways worldwide that display "15 min to next junction." The identifiers are anonymised before any processing: they are transformed so they cannot be linked back to an individual, and only the statistical aggregate is ever used, not any individual trip.
Floating car data: the giant you carry in your pocket
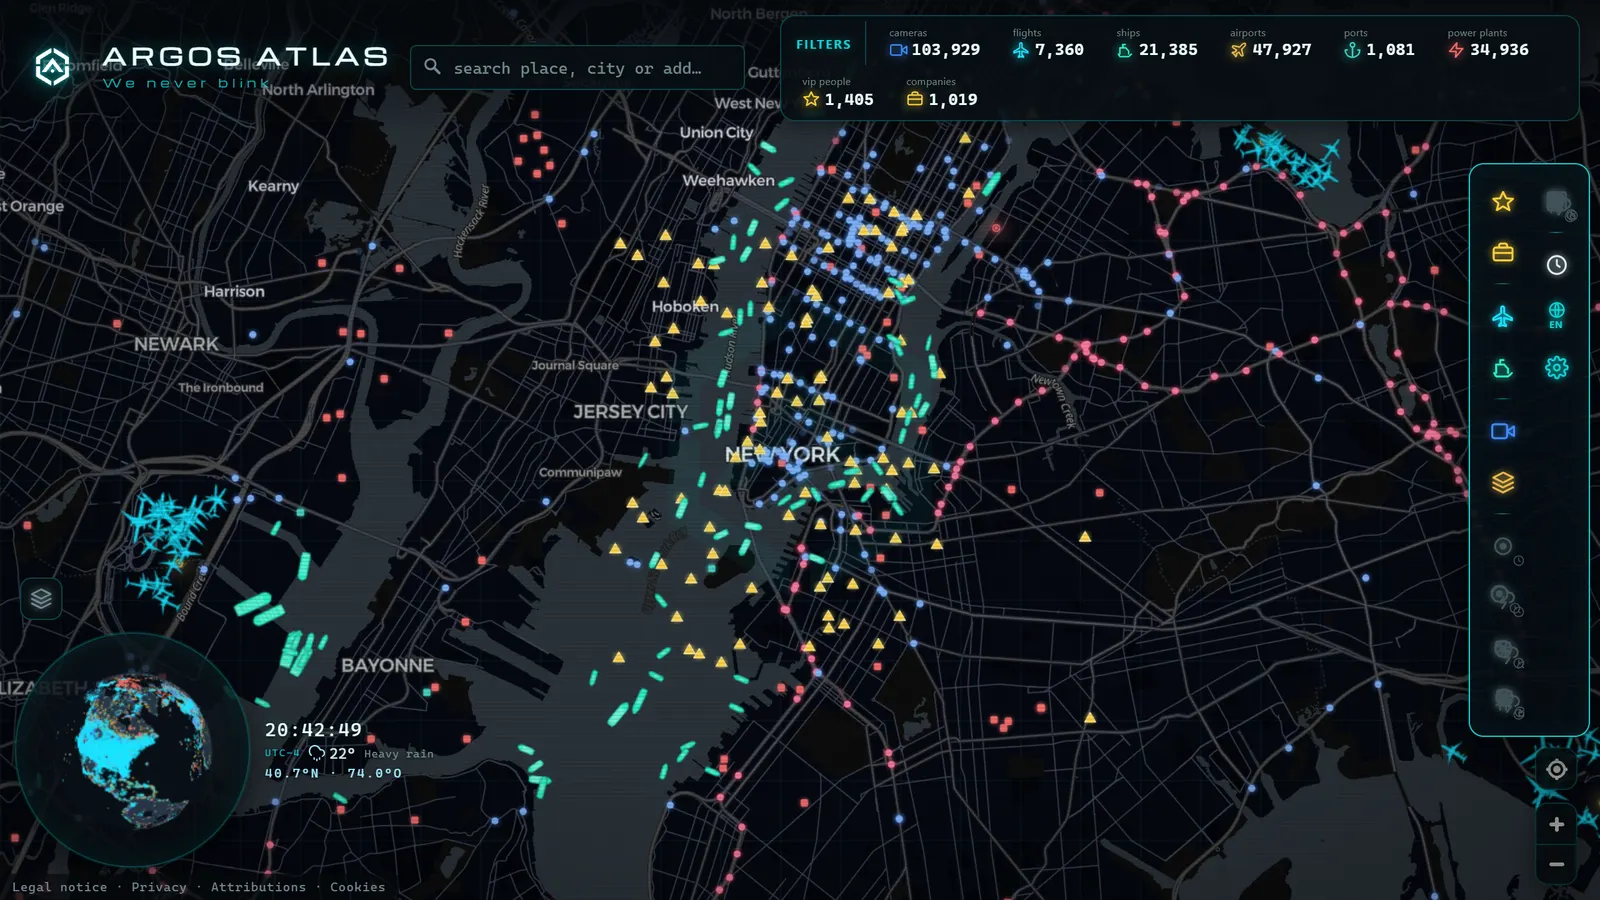
And then there is the method that changed the rules: floating car data (FCD). The idea is to treat every connected vehicle and every phone running a navigation app as a moving sensor. Navigation apps aggregate the anonymous positions of millions of users: if hundreds of devices are moving at 8 mph along a segment where 60 mph is normal, no loop detector is needed to conclude there is a jam.
This is how the red color gets painted on your map. Coverage is the decisive advantage of this approach: it extends to any street where people are driving with a phone, with no infrastructure installed on the road itself. The limitations are real too: it estimates speeds only from users who share data (a sample, not a census), measures traffic volume less accurately, and on very lightly traveled roads the sample may be too small to be reliable.
The map you check every morning is largely a statistical mirror of the drivers themselves, traffic measuring itself.
Networks like Waze, Google Maps, Apple Maps, and HERE all draw heavily on floating car data. Transport authorities in the US (via 511 systems), the UK National Highways, and France ASFA network now routinely incorporate FCD alongside their own sensor networks to fill coverage gaps and validate fixed-point readings.
Traffic census and statistics: annual average daily traffic
Not everything in traffic measurement is real time. Transport authorities exploit their sensor networks to build planning statistics, and the key metric is the annual average daily traffic (AADT): the mean number of vehicles passing a point each day, calculated over the full year. AADT determines whether a road needs an extra lane, where a bypass is warranted, or how travel demand has shifted after a major infrastructure project.
This is the slow, quiet side of measurement: while real-time data helps you decide whether to take the freeway this morning, accumulated census data helps planners shape the network for the next decade. US state DOTs, the UK Department for Transport, and French CEREMA all publish AADT datasets, the raw material for transport planning decisions that last a generation.
From raw data to color: how the red threshold is set
Between the raw measurement and the map there is a translation step. Traffic management systems divide the network into segments and compare measured speed against reference thresholds defined for each specific segment. Near the reference speed: green. Below defined percentages of that reference: amber, red, or dark red. The thresholds depend on road type (25 mph is free flow on an urban street and severe congestion on a freeway) which is why the same color means something different in different places.
It is worth remembering this when reading a map: the color is a statistical estimate for a segment, not a snapshot. And that is where cameras play their distinctive second role.
The special role of cameras: sensor and witness
Among all traffic sensors, cameras have a unique dual function. In addition to producing data, they let you see the situation with your own eyes. A speed figure tells you the segment is slow; the image tells you why: a lane closed for roadworks, an incident on the hard shoulder, snow settling on the carriageway, or simply the dense queue of the morning peak. That capacity for visual verification is why transport agencies publish their camera feeds (from the 511 systems covering every US state to the UK National Highways camera network to the French ASFA feeds) and why checking live traffic cameras has become a routine step before getting on a major road.
If you are curious about the technical details of these devices (what signals they broadcast, how often they update, why some show still frames rather than video) we cover it in the explainer on how traffic cameras work.
Privacy: anonymisation and aggregation
Measuring traffic involves detecting devices and positions, so questions about privacy are legitimate. The industry response rests on two principles. Anonymisation: identifiers are transformed so they cannot be associated with a specific individual. Aggregation: what is published and exploited is collective (average speeds, vehicle counts, journey times) never individual trips. In the European Union, any processing of personal data is subject to the GDPR, which imposes strict obligations on system operators. In the United States, state laws and FTC guidance govern location data use; globally, the industry standard is to ensure that personal re-identification is technically impossible before data leaves the operator system.
As a user, you retain your share of control: your phone location permissions determine whether your positions contribute to navigation services.
Who publishes this data
Much of this information ends up in the open. National transport authorities and city governments publish traffic counts, network states, and camera feeds on their websites and open data portals, the 511 network across US states, the UK National Highways data portal, and French data.gouv.fr datasets among them. Navigation apps and maps are built on top of these sources, blended with proprietary floating data. The ecosystem has its own rules and its own traps (incompatible formats, varying licenses, feeds that go dark without warning) which is why we dedicated a full article to open mobility data published by cities.
Bringing it all together
The next time your map shades an avenue red, you will know everything behind that color: loops counting beneath the asphalt, cameras classifying vehicles in real time, sensors timing anonymous passes between two points, and millions of phones collectively sketching the pulse of the road network. Measuring traffic means combining all those perspectives, and understanding them makes you a sharper reader of any map. If you want to move from the data to the image and see for yourself what a road looks like right now, open the map and browse the live public traffic cameras in your area.
Frequently asked questions
How does Google Maps know there is a traffic jam?
Primarily through floating car data: navigation apps aggregate the anonymous positions of millions of phones and connected vehicles. If many devices are moving well below the normal speed for a given road segment, the system infers congestion and colors the segment red. That signal is supplemented by public sensor feeds and user-reported incidents, but most of the map color comes from the mass of moving users themselves.
What is an inductive loop detector?
A loop of wire buried a few centimetres beneath the asphalt that detects the metallic mass of each vehicle passing over it, based on the disturbance it creates in the loop electromagnetic field. A single loop counts vehicles; two loops spaced a known distance apart measure speed; the duration of the disturbance estimates the vehicle length. It is the veteran technology of traffic census and remains one of the most reliable methods at a fixed point.
Is my phone being used to measure traffic?
If you use navigation apps with location enabled, the answer is almost certainly yes: your position, anonymised and combined with millions of others, contributes to speed estimates for road segments. The system works with statistical aggregates, not your individual journey. If you prefer not to participate, your device location permissions are the switch.
Which method is most reliable?
It depends on what you want to measure. Inductive loops are excellent at counting vehicles and measuring speed at a fixed point, but they are blind everywhere else. Floating data covers virtually the entire network and reflects real speeds well, but estimates vehicle counts less accurately. Cameras add the visual verification that no number can provide. That is why traffic management centres do not choose, they fuse multiple sources and cross-check them against each other.
Why does the same color mean different things on different roads?
Because the thresholds are set relative to each road reference speed. Traveling at 40 mph may be normal flow on a city boulevard but severe congestion on a freeway. Traffic management systems compare measured speed against a baseline for each specific segment, so red always means significantly slower than expected here, not a fixed speed.