Blog · Urban mobility
Open Mobility Data: What Cities Publish and How to Use It
Every time a map app tells you when the next bus arrives, there is a file published by a public authority behind it, a file that anyone, including you, can download for free. Open mobility data is one of the best-kept secrets hiding in plain sight in modern cities: traffic conditions, public transit, bike-share, parking, and camera feeds all published for anyone to reuse. This article covers exactly what cities publish, why they do it, where to find it, and how to make use of it without writing a single line of code, without glossing over the real problems in the ecosystem.
What Open Data Actually Means
An open dataset is information published by public authorities for free reuse. The definition rests on two pillars, and both matter. The first is access: the data is publicly available, in machine-readable formats, ideally without registration barriers. The second is legal: it is published under licences that explicitly permit reuse, transformation, and redistribution (generally including commercial use) usually in exchange for attribution.
That second pillar is what separates open data from merely visible data. A website where you can look up traffic conditions is not, by itself, open data; it becomes open data when the authority publishes the underlying dataset with a licence that expressly authorises you to take it and build on top of it. Mobility has become the star of this movement for a straightforward reason: it is the domain where public data translates most directly into everyday utility for millions of people.
What a Typical City Publishes
The offering varies, but the catalogue of a reasonably advanced city tends to cover these families:
- Traffic conditions and flow counts. Data from sensors measuring circulation: how many vehicles pass each point and at what speed, sometimes in near-real time and sometimes as historical series. This is the raw material for congestion maps; how it is captured is covered in detail in how traffic is measured.
- Public transit: schedules and positions. Here a standard deserves its own name: GTFS (General Transit Feed Specification), the format describing routes, stops, and schedules for a transit network, with a real-time extension for vehicle positions and service alerts. It has become the global lingua franca of public transport: if your map app knows when your bus is coming, it is almost certainly because the operator publishes its network in GTFS.
- Bikes and shared scooters. The equivalent standard is GBFS (General Bikeshare Feed Specification), which describes stations, vehicle availability, and system status. Thanks to it, a single app can show shared-bike systems across cities worldwide, from New York's Citi Bike to London's Santander Cycles to Paris's Velib'.
- Parking. Location of car parks and, in the most advanced cities, real-time space availability.
- Roadworks and street closures. Events disrupting the road network: closed streets, diversions, planned disruptions.
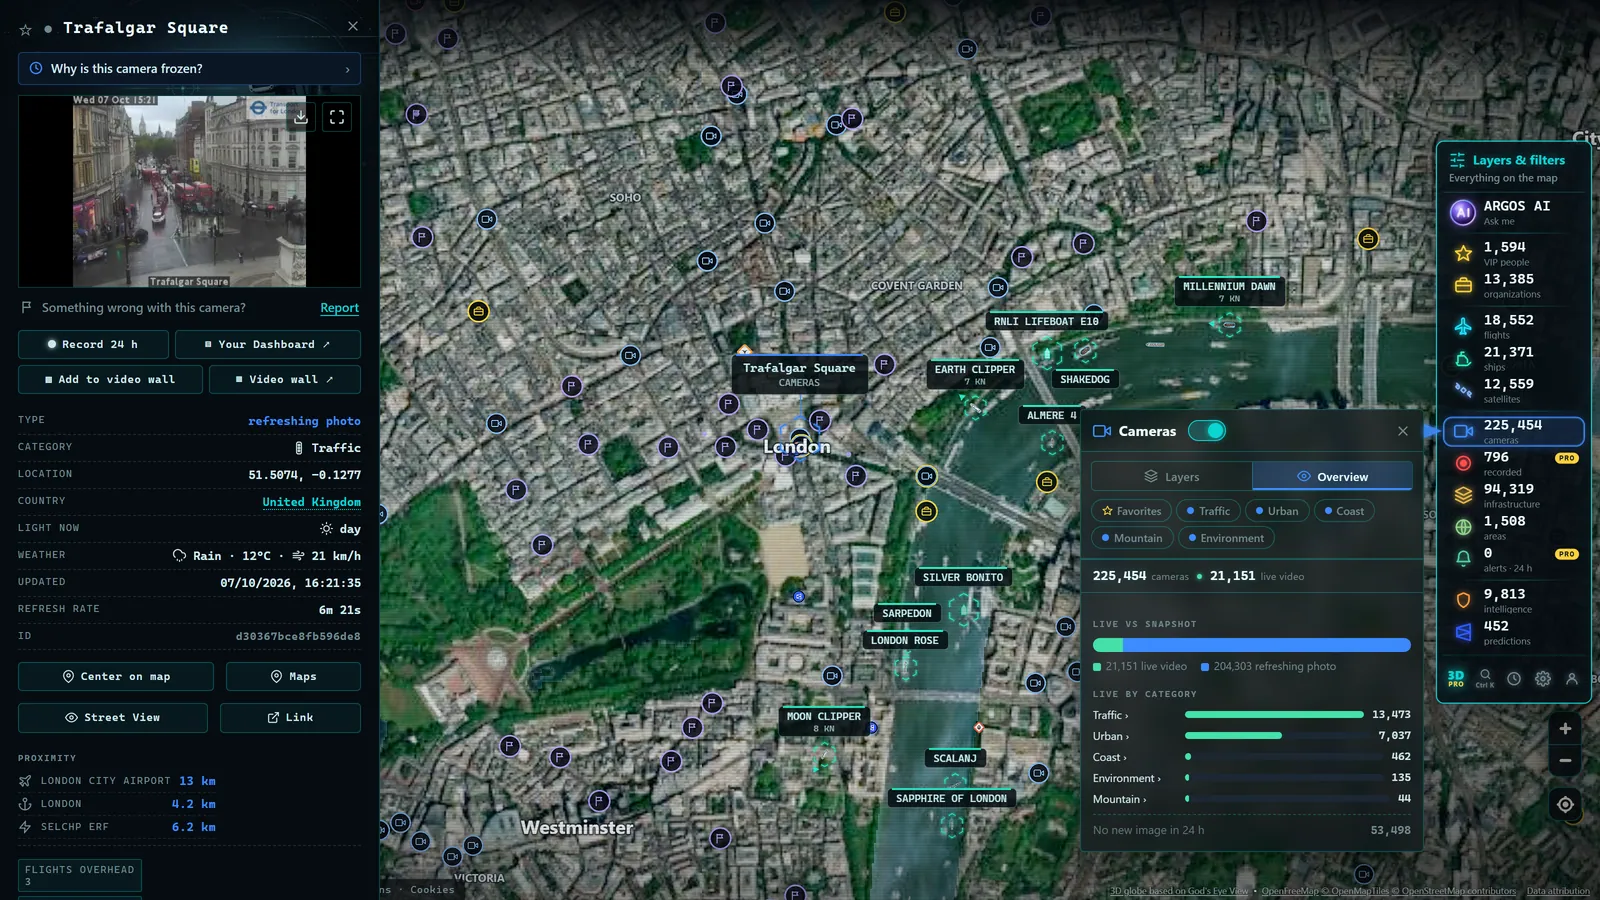
- Traffic cameras. Many authorities publish lists of their public cameras with location and the image they stream. This is a distinctive source because it delivers not a number but a verifiable image, which is why it is so valuable for confirming what other data can only estimate.
Why Cities Do It: Transparency, Law, and Innovation
That an authority would give away its data might sound like spontaneous generosity, but three concrete drivers sit behind it.
The first is transparency: the data is generated with public money, and publishing it lets citizens see and audit how their city functions. The second is regulatory: in the European Union, the Open Data Directive and its implementing regulations push authorities to release their datasets, with particular emphasis on high-value data categories, among which mobility features prominently. Beyond Europe, similar obligations exist in the US under the OPEN Government Data Act and in the UK under the Public Sector Information Regulations. Opening data is, increasingly, a legal requirement rather than a discretionary act.
The third driver is the most tangible: innovation. The transit apps you use daily, the route planners, the congestion maps, the mobility dashboards, much of that ecosystem exists because public data is open. The authority publishes the raw material and a swarm of developers, companies, and curious individuals turns it into services the authority itself would never have built alone.
The best transit app for your city was probably not built by your city council. It was built by someone who reused the data your city council published.
From the ARGOS ATLAS channel.
Where to Find It: National and Municipal Portals
The standard entry point is open data portals. These exist at multiple levels: national portals that aggregate catalogues from across a country (in the US, Data.gov; in the UK, data.gov.uk; in France, data.gouv.fr; in Germany, govdata.de) and, most importantly, municipal portals, where major cities publish their own catalogues with hundreds or thousands of datasets.
Complementing these are sector-specific sources: traffic authorities publish their data and camera feeds on their own platforms (in the US, state 511 systems; in the UK, National Highways; in France, the ASFA network), and transit operators typically maintain developer portals where they serve their GTFS feeds. The landscape is somewhat fragmented (each authority organises its own data its own way) and that fragmentation is precisely one of the challenges covered shortly.
Who Reuses It: From Data Journalists to Aggregators
Who is on the other side, downloading all of this? Four main profiles.
App developers, who turn feeds into products: from the independent bus app for your city to the mapping giants integrating GTFS from across the planet. Data journalists, who cross-reference traffic series, roadworks, and transit data to tell stories about how a city moves, or grinds to a halt. Think of the investigative teams who have mapped congestion inequities across NYC, Chicago, and LA, or transit access gaps across London boroughs. Researchers and urban planners, for whom these datasets are study material on mobility patterns, air quality, or inequality in transport access.
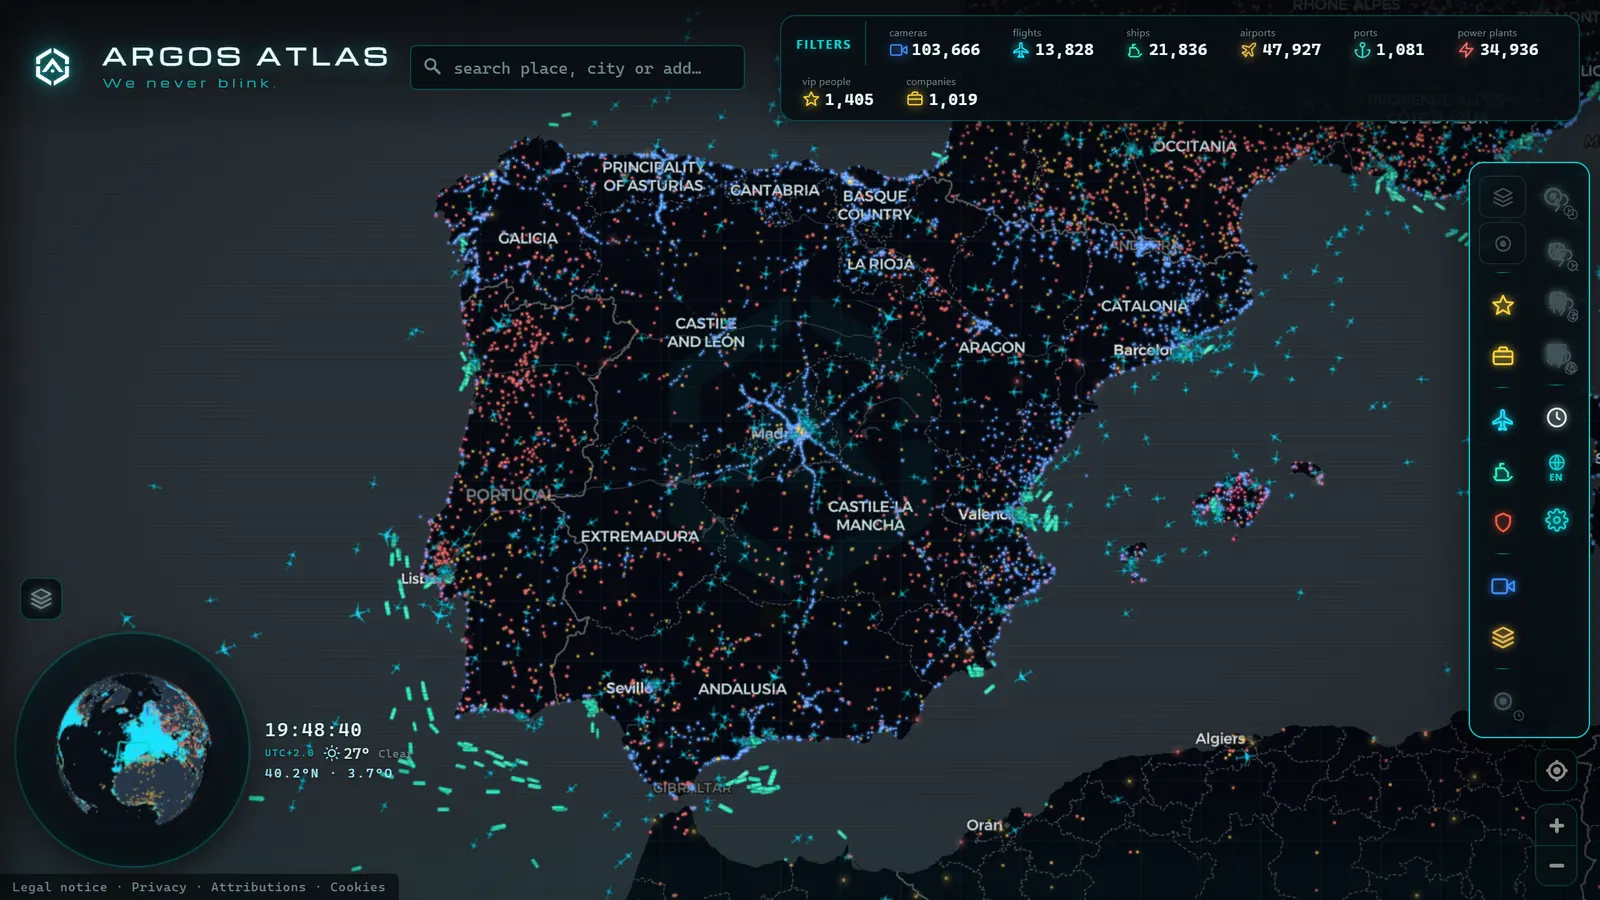
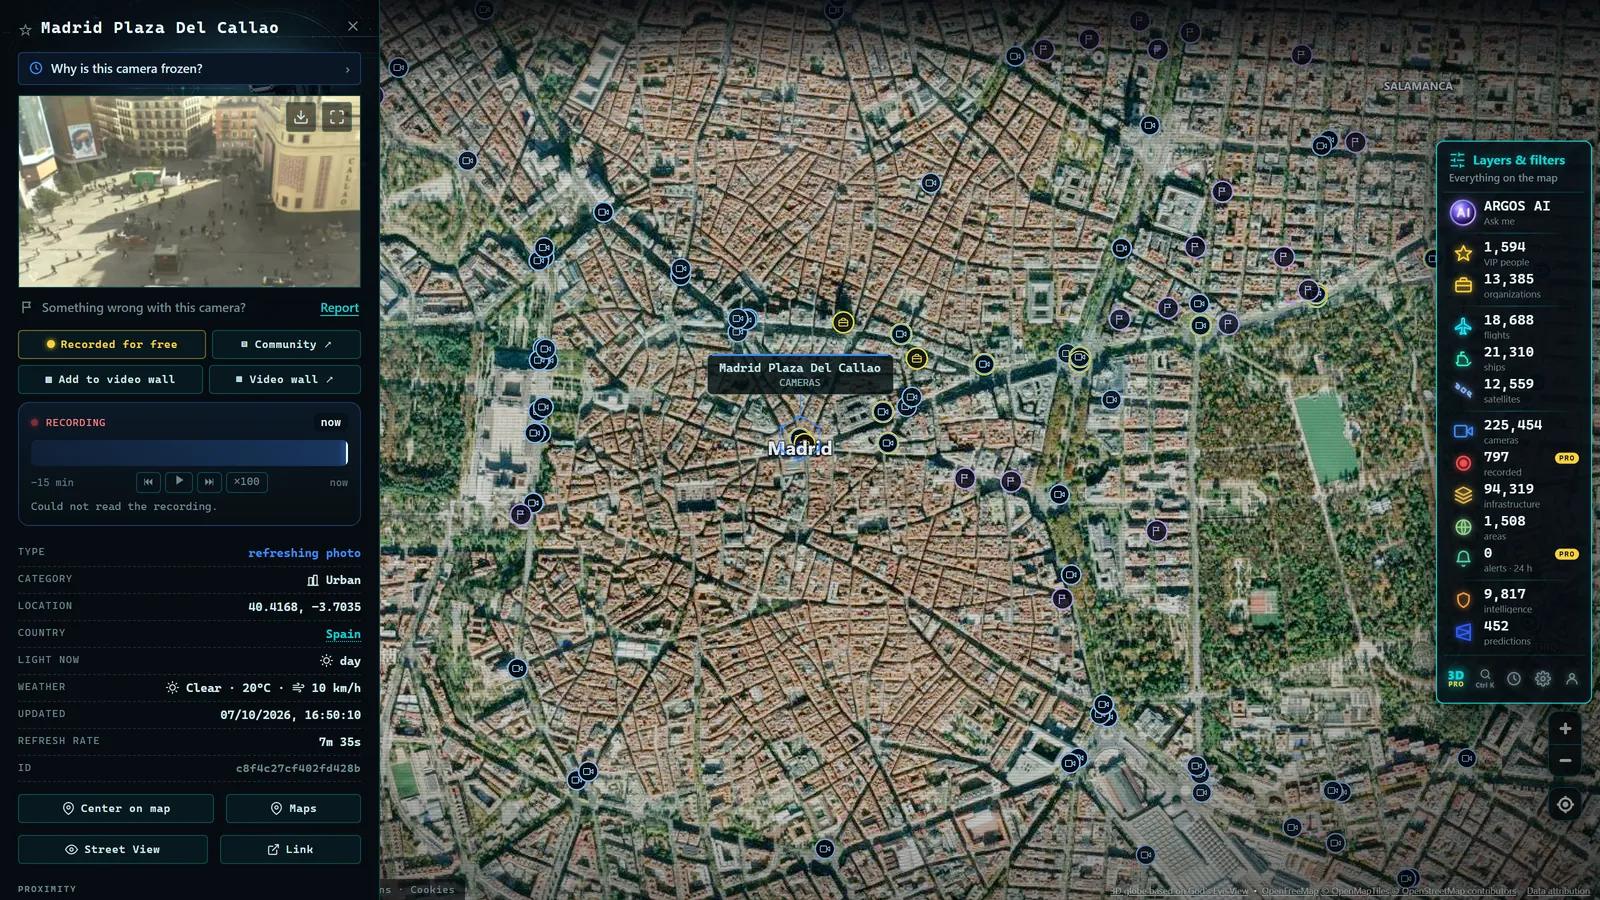
And a fourth profile: aggregators, who take dispersed sources and bring them together into a single coherent place. Argos Atlas is exactly that: a public-data reuser that aggregates official traffic cameras (published in fragmented form by dozens of different authorities across dozens of countries) into a single worldwide map, geolocated and with sources cited. The value lies not in creating the data, which is public, but in the aggregation, curation, and visualisation of what already exists but no one could see together; the approach is explained in detail on the sources and methodology page.
The Honest Challenges: The Rough Side of Open Data
It would be misleading to paint the ecosystem as a paradise. Anyone working seriously with open mobility data will encounter four recurring problems.
Uneven quality. Some datasets are impeccable, updated by the minute, and well documented. Others have incorrect coordinates, empty fields, or descriptions that do not match the content. The "open" label does not guarantee the "good" label.
Heterogeneous formats. Despite standards like GTFS and GBFS, a great deal of publishing remains artisanal: each authority with its own structure, field names, and quirks. Integrating ten cities can mean writing ten separate adapters.
Unclear licences. It is not always obvious under what conditions a dataset is published, and sometimes the declared licence contradicts the legal notices elsewhere on the website. For any serious reuser, clarifying this upfront is obligatory.
Feeds that die without warning. A URL that worked yesterday stops responding. An authority redesigns its website and breaks every link. A dataset freezes at a past date and nobody withdraws it. This is why continuous curation (periodically verifying that each source is still alive, correcting what changes, retiring what dies) is not an optional extra but the core of any aggregator's real work. A map of public sources is only as good as its maintenance.
How to Start Exploring Without Writing Code
The good news: you do not need to write a single line of code to benefit from this world. The most direct route is through viewers and maps already built on top of these datasets. Many municipal portals include their own visualisers where you can explore datasets on a map without downloading anything; traffic authorities offer viewers with incidents and camera feeds; and aggregators do the work of bringing dispersed sources together so you only have to look.
A reasonable itinerary for a curious newcomer: start with the traffic viewer from your relevant authority and your city's open data portal, identify what mobility datasets they publish, then try an aggregator map to see your city in a global context. Cities like New York (NYC Open Data), Chicago (Chicago Data Portal), and Los Angeles (LA Open Data) have particularly rich portals worth exploring even if you live elsewhere. If the curiosity takes hold, the next step (downloading a GTFS feed and opening it, connecting a live feed to a spreadsheet) is more accessible than it sounds. And to understand how all of this fits into the broader instrumented city, the article on smart cities and real-time data completes the picture.
Frequently Asked Questions
What mobility data do cities publish?
The typical catalogue includes traffic conditions and sensor flow counts, public transit schedules and positions (usually in GTFS format), shared bike and scooter availability (GBFS), parking location and occupancy, roadworks and street closures, and public traffic cameras with their locations. The breadth and freshness vary enormously between cities: some publish dozens of real-time datasets; others offer only a handful of static files.
What is GTFS?
General Transit Feed Specification: the standard format for describing public transit networks (routes, stops, schedules, and calendars) with a real-time variant for vehicle positions and service alerts. It began as a practical standardisation effort and is now the sector's lingua franca: the reason major map apps can display transit for thousands of cities is that operators publish their networks in this common format.
Can anyone use open data?
Yes, that is precisely its purpose. Open data is published under licences that permit free reuse, including commercial use in most cases, with typical conditions such as attribution. Two practical tips: read the specific licence of each dataset before building anything serious on top of it, and do not confuse "visible on a website" with "open": the latter requires an explicit reuse authorisation.
Why is open data sometimes out of date?
Because publishing is easy and maintaining is expensive. Behind every live dataset there is someone updating systems, monitoring feed responses, and correcting errors, resources that do not always exist or survive shifts in priorities. The result is dead URLs, broken formats, and datasets frozen in time. Any serious reuser accepts continuous curation as part of the job: verifying sources, correcting what changes, retiring what stops working.
Conclusion
Open mobility data is the invisible scaffolding of half of urban life: every bus schedule on your phone, every congestion map, every camera viewer exists because a public authority published the raw material and someone turned it into something usable. The ecosystem has its rough edges (uneven quality, disparate formats, feeds that die) but the direction is clear and the benefit is substantial. The best way to understand it is to use it: open the map and explore thousands of public traffic cameras aggregated from official sources around the world. You are looking at open data in action.
Frequently asked questions
What mobility data do cities publish?
The typical catalogue includes traffic conditions and sensor flow counts, public transit schedules and real-time vehicle positions, shared bike and scooter availability, parking occupancy, roadworks and street closures, and public traffic camera feeds. The exact offering varies considerably from city to city.
What is GTFS?
General Transit Feed Specification: the standard format for describing public transit networks (routes, stops, schedules, and calendars) with a real-time extension for vehicle positions and service alerts. It has become the lingua franca of the sector; when a map app shows you when your bus arrives, it is almost certainly reading a GTFS feed published by the operator.
Can anyone use open data?
Yes, that is the whole point. Open data is published under licences that permit free reuse, including commercial use in most cases, typically requiring attribution. Always read the specific licence before building anything serious on top of a dataset, and remember that a website where you can view data is not the same as open data: the latter requires an explicit reuse authorisation.
Why is open data sometimes out of date?
Because publishing data is easy and maintaining it is costly. Behind every live dataset there is someone keeping systems updated, checking that feeds respond, and fixing errors, resources that do not always exist or survive budget cuts. The result is dead URLs, broken formats, and datasets frozen in time. Any serious reuser treats continuous curation as a core part of the job.