Blog · Urban mobility
Smart Cities: How Urban Data Systems Work in Real Time
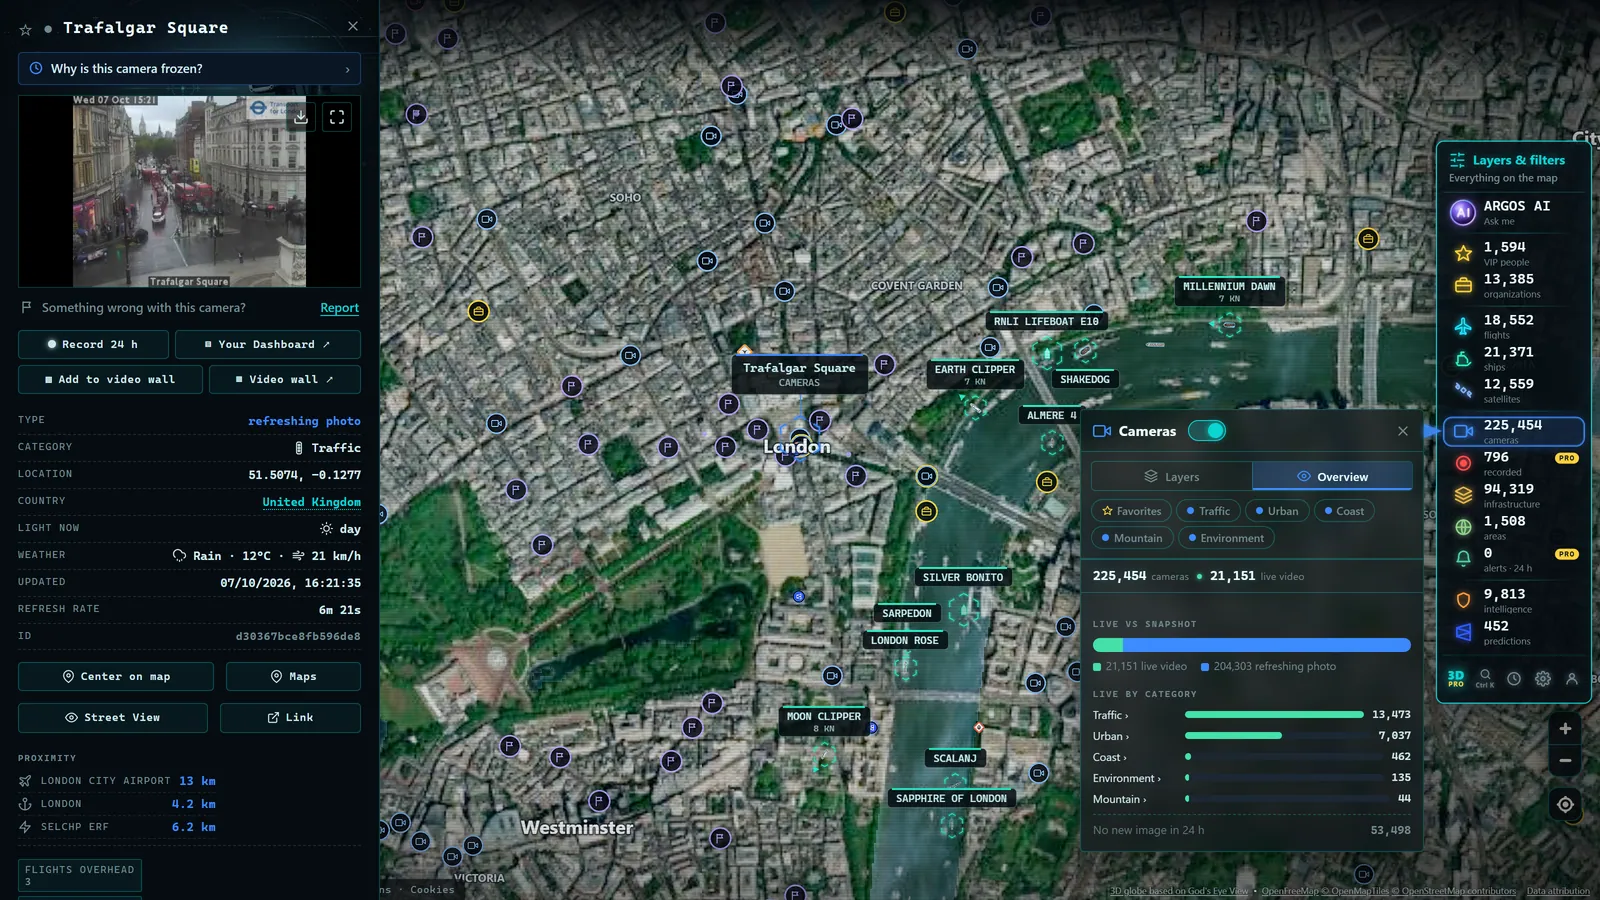
When someone searches for smart city examples, they typically expect a list of futuristic cities with giant screens and self-driving cars. The reality is less cinematic and considerably more interesting: a smart city is, above all, a city that measures what happens on its streets, converts that activity into data, and makes operational decisions with it. Sensors, networks, and a human team that prioritizes, that is the whole system. Done well, it changes how traffic flows, how waste is collected, how streetlights behave, and how quickly a water main break gets detected before the road caves in.
This article cuts through the hype, examines the real layers that make up a smart city, references the well-documented benchmarks honestly, acknowledges the risks openly, and closes with something rarely discussed: thanks to open data, you can look at your city almost the same way an operator looks at a control room.
What a Smart City Actually Is (Without the Hype)
A smart city is not about attractive screens: it is sensors plus data plus measurable operational decisions. The useful definition has three legs:
- Sensors and data sources: inductive loops in asphalt, traffic cameras, bus GPS transponders, water meters, environmental sensors.
- A data layer: systems that collect, clean, and cross-reference all that information in near-real time.
- Decisions that can be measured: changing a signal cycle, dispatching a waste truck early, detecting a pipe leak before the street collapses.
If the third leg is missing, there is no smart city, just an expensive one. Installing sensors without anyone acting on their data is the urban equivalent of buying a fitness tracker and never exercising. The right question to evaluate any smart city project is not "how much technology does it have?" but "what operational problem does it solve and how is the improvement measured?"
The Typical Layers of a Smart City
Almost every urban data management project is built on the same layers. The order and ambition vary; the menu repeats.
Traffic and Adaptive Signals
This is the most mature layer. Inductive loops, cameras, and radar sensors count vehicles and measure speeds; with that data, traffic signals adjust their cycles according to real demand rather than a fixed schedule. The goal is not to eliminate congestion (that depends more on urban design than on electronics) but to distribute it more evenly and respond quickly to incidents. Systems like the US DOT's Connected Vehicle Program, the UK's Urban Traffic Management and Control (UTMC) network, and similar deployments across Europe and Asia have been running adaptive signal algorithms for years.
Live Public Transit
Buses and metros have been broadcasting their position for decades. The smart layer is exploiting that feed: real-time arrival displays that show actual minutes (not schedule estimates), frequency adjustment based on demand, and open data APIs so any third-party app can use the stream. Cities from New York's MTA to London's TfL to Singapore's LTA have invested heavily here.
Waste Collection with Fill-Level Sensors
A fill-level sensor inside a container lets the truck arrive when needed, not when the calendar says so. Fewer empty runs, fewer overflowing bins. This is one of the cases with the easiest-to-demonstrate return on investment, and it has been deployed at scale in cities including Chicago, Seoul, and several Nordic capitals.
Intelligent Street Lighting
LED streetlights regulated by presence and time of day: they dim in the early hours on empty streets and brighten when motion is detected. Each connected fixture also reports its own status, which turns maintenance from reactive to proactive. Cities from Los Angeles (one of the world's largest smart-lighting deployments) to Copenhagen have demonstrated multi-million-dollar savings in energy costs.
Water Networks and Leak Detection
Pressure and flow sensors distributed through the water network detect anomalies that indicate underground leaks before the road surface gives way. In aging networks (common in the US Northeast, the UK, and across Europe) water lost in transit is a massive and largely silent problem. Measuring it is the first step toward reducing it.
Environmental Quality
Monitoring stations measuring air pollutants, noise levels, and meteorological conditions feed both operational decisions (traffic restrictions, public alerts) and public information services.
The Urban Operations Center: Where It All Converges
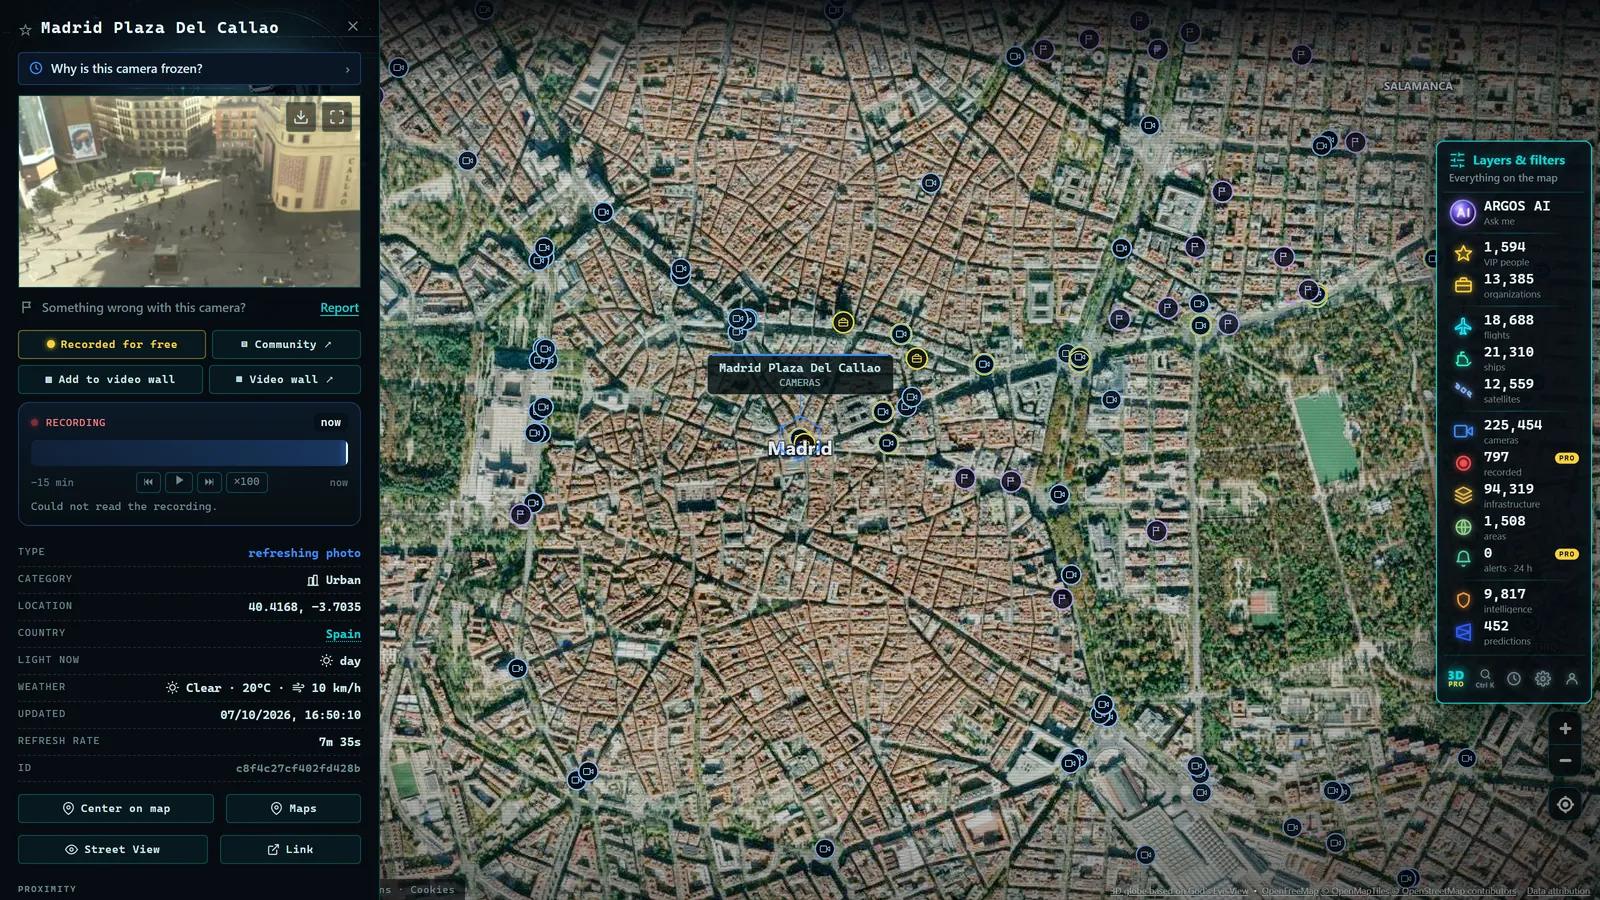
All those layers end up in the same place: the control center. It is a room with dashboards integrating traffic, transit, emergency services, and urban utilities on shared screens, where operators do not watch data for the sake of watching, they prioritize incidents. An accident blocking a main artery outweighs a stuck pedestrian signal; a burst water main outweighs a full waste container.
The point of the operations center is not the large screen, it is the protocol: who sees what, who decides what, and how quickly action follows. Cities that function well with data tend to have boring, well-rehearsed protocols. Cities that only have the screen are left with an opening-day photo opportunity.
From the ARGOS ATLAS channel.
Real Examples: the Benchmarks That Keep Appearing
If you review the literature on intelligent cities, the same names recur as benchmarks for data-driven urban management:
- Singapore, consistently cited for its integrated sensor network and its centralized traffic and transport planning. The city-state's Virtual Singapore platform and Intelligent Transport System are among the most studied in the world.
- Barcelona, a European pioneer in deploying urban sensor grids and publishing their data openly. The Superblock project combined mobility data with physical redesign to measurable effect.
- Amsterdam, a reference for collaborative pilots where city government, businesses, and residents share data. The Amsterdam Smart City platform has run hundreds of experiments since 2009.
You do not need to attribute miraculous figures to understand why these cities are cited: all three have spent years converting data into operational decisions and documenting the process. And it is worth saying: many mid-sized cities in the US, UK, and elsewhere are already applying partial versions of these layers without appearing on any global ranking. The real smart city is less an exclusive club and more a gradual process.
What Works When It Is Done Right
When the measure-analyze-act loop functions, the benefits are concrete:
- Faster response times: an incident detected by sensors and cameras is addressed sooner than one that depends on someone phoning a hotline.
- Predictive maintenance: connected streetlights, pumps, and signals report their own deterioration before failing, which reduces repair costs and service outages.
- Transparency: if the data exists, it can be published. Open data portals allow journalists, researchers, and residents to audit what the city does and propose uses that city hall would never have imagined.
The Honest Risks
A serious article on what a smart city is must also address the other side.
Privacy and surveillance. A dense network of sensors and cameras is, technically, a surveillance infrastructure. Whether it is used as one depends on legal and political decisions, not on the technology. GDPR in Europe, and a growing patchwork of US state privacy laws, regulate personal data handling. Best practices require anonymizing data, aggregating rather than identifying, and publishing clearly what is collected, for what purpose, and for how long. A city that does not answer those questions clearly deserves skepticism.
Vendor lock-in. Many urban systems are contracted from technology companies using closed data formats. If the city does not require open standards and ownership of its own data, it becomes tied to the vendor: switching systems becomes prohibitively expensive and the municipality loses control of its own information.
Technological solutionism. The subtlest risk. The sensor does not fix what urban design breaks: if an arterial road is fundamentally undersized, no adaptive signal will save it at peak hour. Congestion is primarily a problem of demand and design. Data helps manage it better; it does not replace the difficult decisions about how street space is allocated.
A quick rule for evaluating any smart city project: if the presentation says more about the technology than about the problem it solves, be skeptical.
The Citizen as Observer: Your Own Control Room
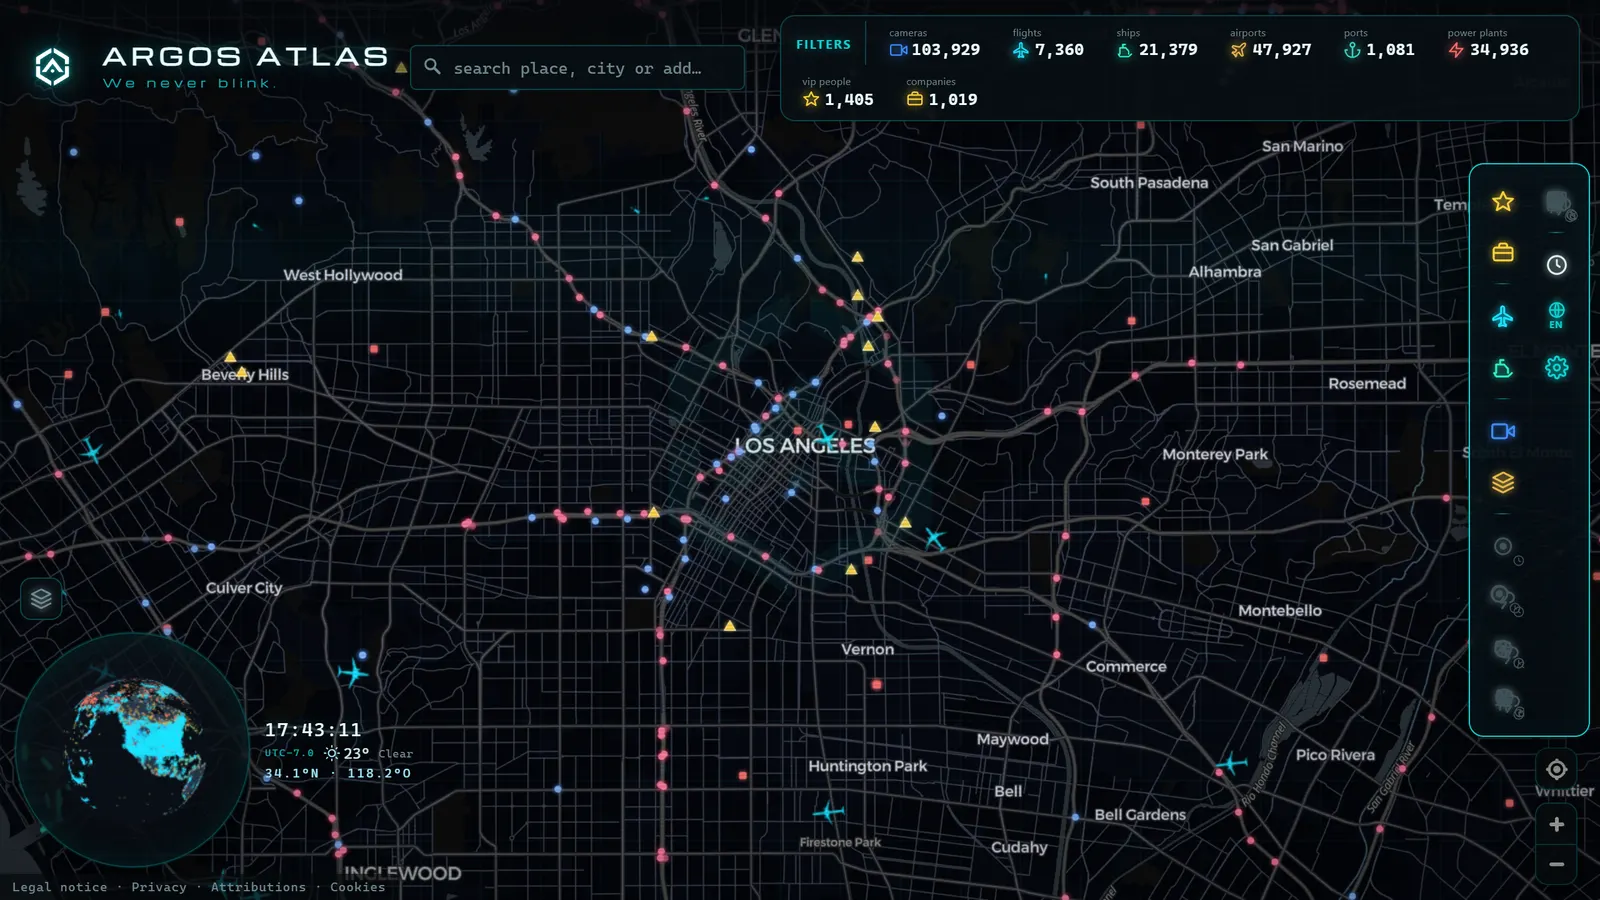
Here is the part that almost nobody discusses. Much of the data that feeds urban control centers is already public: transit positions, traffic states, environmental measurements, and (especially) the public traffic cameras that official agencies publish openly. That means you, from home, can look at your city almost the way an operator does: check the real state of road access, see whether it is raining on the other side of town, observe how traffic evolves through the day.
Tools like Argos Atlas make that access straightforward by aggregating thousands of official traffic cameras and context layers (flights, ships, infrastructure) on a single interactive map, free and without registration, always citing the original source of each data feed.
This is not a curiosity for enthusiasts: citizens being able to see the same data as the administration is one of the healthiest guarantees that a smart city does not become a black box.
What to Ask Your City as a Resident
If your city government claims to be a smart city, these are legitimate questions you can ask:
- What specific problem does each system solve, and how is the improvement measured?
- What data is collected about individuals, how is it anonymized, and who holds it?
- Are the data published openly so anyone can consult them?
- Does the city own its data and systems, or is it dependent on a single vendor?
- Is there a clear channel to report errors and request removal of information?
A smart city that answers these five questions well is probably doing things reasonably right. One that evades them is buying technology, not intelligence.
Frequently Asked Questions
What exactly makes a city smart?
Not the sensors themselves, but the complete loop: measure, analyze, and act. A city is smart when it uses real-time data to make measurable operational decisions, adjusting signals based on actual traffic, collecting waste when containers are full, detecting leaks before they break the surface. The technology is the instrument; the intelligence is in the decision process and the ability to verify the results.
What are real-world smart city examples?
Singapore, Barcelona, and Amsterdam are repeatedly cited as benchmarks: adaptive traffic signals, live public transit feeds, sensor networks, and open data platforms have been running there for years and are well documented. But the phenomenon is broader: many mid-sized cities in North America, the UK, and Europe are already deploying partial versions of the same layers without appearing on any international ranking.
What about privacy?
It is the most serious risk and deserves to be taken seriously. A dense network of sensors and cameras can become a surveillance system if there are no clear limits. GDPR in Europe and state-level privacy laws in the US regulate personal data handling. Best practices require anonymizing data, aggregating rather than identifying, and publishing clearly what is collected, for what purpose, and for how long. As a resident, you have the right to ask and to receive concrete answers.
Can I see live data from my city?
In many cases, yes. Numerous cities publish open data portals with traffic, transit, environmental, and public camera information. Tools like Argos Atlas aggregate thousands of official traffic cameras and context layers on a single map, freely accessible without registration, so you can observe your city almost as a control center operator would.
Conclusion
A smart city is not a city full of screens: it is a city that has learned to measure, decide, and correct. The layers (traffic, transit, waste, lighting, water, environment) are the instruments; what matters is that behind them sit measurable decisions, open data, and respect for privacy. And the best part of the model, when it works, is that it is not reserved for the engineers in the control room. Public data lets you look at your city with the same eyes. To try it now, you can open the map and see official traffic cameras and live context layers for your area in real time.
Frequently asked questions
What exactly makes a city smart?
Not the sensors themselves, but the complete feedback loop: measure, analyze, and act. A city becomes smart when it uses real-time data to make measurable operational decisions, adjusting traffic signals based on actual congestion, prioritizing maintenance based on impact, rerouting buses when a line is delayed.
What are real-world smart city examples?
Singapore, Barcelona, and Amsterdam are repeatedly cited as benchmarks for data-driven urban management: adaptive traffic signals, live public transit, sensor-equipped waste containers, and open data platforms. Many mid-sized cities in the US, UK, and Europe are already deploying partial versions of these same layers without making any global ranking.
What about privacy?
It is the most serious risk. A dense network of sensors and cameras is technically a surveillance infrastructure. Whether it gets used as one depends on legal and political decisions, not technology. In the EU, GDPR regulates personal data handling; similar frameworks exist in US states. Best practices require anonymizing data, publishing what is collected and for what purpose, and setting clear retention limits.
Can I see live data from my city?
In many cases, yes. Numerous cities publish open data portals with traffic, transit, air quality, and camera feeds. Tools like Argos Atlas aggregate thousands of official traffic cameras and context layers on a single map, free and without registration.