Blog · Urban mobility
Why Traffic Jams Form (and How to Avoid Them Using Real-Time Data)
You are cruising along a highway (traffic is heavy but moving) and suddenly everything stops. You crawl along for ten minutes, expecting to find the accident that explains it all, and there is nothing. The road opens up and you are back to full speed, as if nothing happened. Understanding why traffic jams form (including those phantom jams with no apparent culprit) means entering one of the most fascinating branches of engineering: traffic science, which treats roads almost like pipes and vehicles almost like a fluid. And it has a practical payoff: once you understand the mechanism, avoiding congestion with real-time data stops being a matter of luck.
The Physics of Congestion: Every Road Has a Limit
Start with the fundamental law: every road has a maximum capacity, a number of vehicles per hour that each lane can handle. Well below that limit, traffic is stable: if someone brakes, the vehicles behind absorb the disturbance with room to spare and flow re-establishes itself.
The problem appears near the limit. In dense traffic, the gaps between vehicles shrink, drivers have less reaction time, and the system enters an unstable state: any small disturbance can collapse the flow. A truck overtaking slowly, a driver hesitating at an exit, a brief touch of the brakes. And here emerges the central paradox of traffic engineering: when a road collapses, it goes from moving many vehicles quickly to moving fewer vehicles slowly. A traffic jam is not just an inconvenience; it is the road operating below its own capacity.
This is why jams do not grow gradually and proportionally. A road can absorb one increase in traffic after another without flinching, and then, crossing a certain threshold, degrade all at once. It is a phase change, similar to water freezing: nothing, nothing, nothing, and then suddenly, ice.
The Phantom Jam: A Wave Travelling Backward
The most counterintuitive traffic phenomenon is the phantom jam: a queue that forms without any accident, roadworks, or visible cause. Its mechanics are well documented in traffic engineering and are pure wave propagation.
Picture dense traffic moving at 65 mph on an American interstate. One driver brakes slightly, distracted, surprised by a bend. The driver behind, with little margin, brakes a little harder to compensate for reaction time. The third driver, harder still. A few dozen vehicles later, someone stops completely. A braking wave has been born that propagates backward, in the opposite direction of travel, and can survive for miles and many minutes. By the time you reach the point where it all started, the original cause vanished long ago, which is why you never find the culprit.
This phenomenon is well studied across major urban corridors. On the I-405 in Los Angeles, the I-290 approaching Chicago, the I-610 loop around Houston, and the New Jersey Turnpike feeding into New York City, traffic engineers have documented recurring phantom jams that appear daily at the same locations, triggered not by incidents but purely by density crossing a threshold. European equivalents exist on the M25 around London, the Paris Périphérique, and the A100 in Berlin.
There is a classic experiment that demonstrates this elegantly: a group of drivers is asked to circulate on a closed loop at constant speed, with no obstacles or merging traffic. At first they succeed; after a short while, small human variations amplify and a stop-and-go wave spontaneously appears, travelling backward around the loop, a miniature jam with no external cause at all. The lesson is uncomfortable but liberating: with sufficient density, jams do not need a reason; we provide one ourselves.
A phantom jam wave behaves like a stadium wave: no individual moves from their seat, but the wave travels the full circuit.
The practical implication is also well studied: maintaining a safe following distance and steady speed dampens these waves rather than amplifying them. Every sharp braking event you avoid is one fewer wave you pass on to the drivers behind you.
Peak Hours: Demand Arriving in Waves
If capacity is fixed, what decides collapse is demand, and demand does not spread itself evenly: it arrives in waves. Commuting to work and school concentrates an enormous share of traffic into two narrow windows, morning and evening, which is precisely what we call rush hour. The road that has spare capacity at 11 a.m. is overwhelmed at 8:15 a.m.
The pattern has nuances that any regular commuter will recognise. In New York City, the Lincoln and Holland Tunnels log their worst inbound numbers between 7:30 and 9:00 a.m. on Tuesdays through Thursdays; Mondays and Fridays are measurably different. In Los Angeles, the I-10 westbound evening peak can stretch from 4:00 to 7:30 p.m. on the same corridor that runs freely at midday. Chicago's Dan Ryan Expressway and Houston's Katy Freeway follow the same logic: peak demand in tight windows, relative ease in between.
The same pattern plays out across UK cities, where Transport for London data shows the Tube and surface roads peaking between 8:00 and 9:30 a.m. and again between 5:00 and 7:00 p.m. on weekdays, with marked differences between Monday, mid-week, and Friday. Congestion at peak hours is ultimately a problem of collective synchronisation: too many people wanting to use the same infrastructure at the same moment.
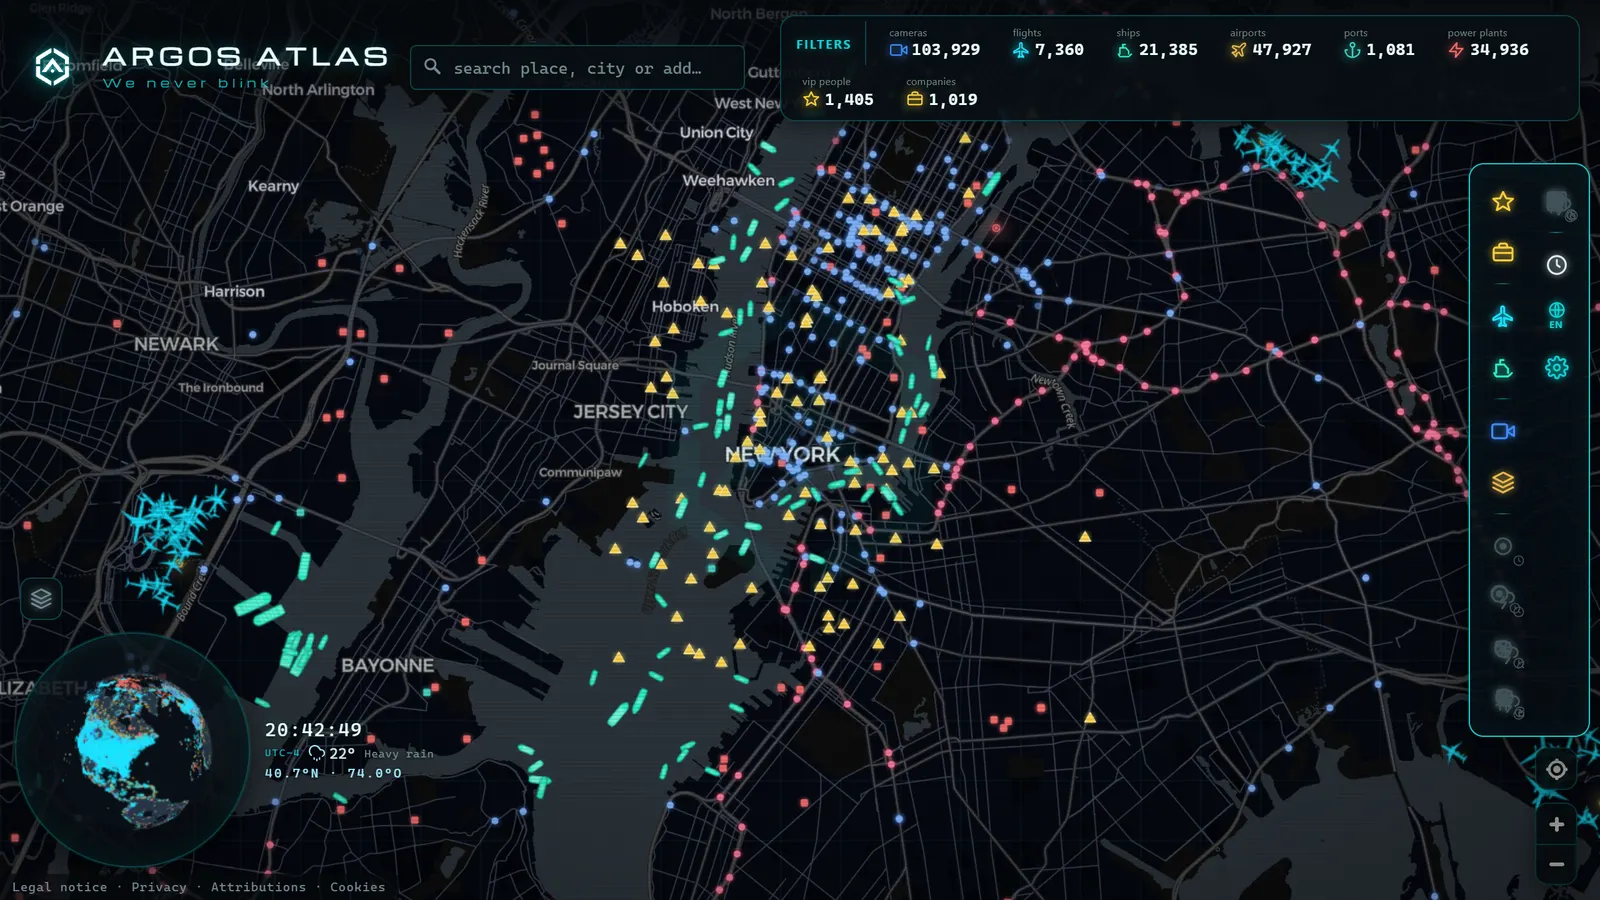
From the ARGOS ATLAS channel.
Classic Bottlenecks: Where Capacity Narrows
There are points in the network where jams are not bad luck but geometry. These are bottlenecks, and it helps to have them mapped:
- On-ramps and weave sections. Every vehicle entering from a slip road forces those on the main carriageway to create a gap; in dense traffic, that constant friction triggers braking waves. Stretches where traffic enters and exits within a short distance are congestion factories.
- Tunnels and bridges. They concentrate lanes, eliminate hard shoulders, and the environment alone causes many drivers to instinctively ease off the accelerator. A small speed reduction multiplied by thousands of vehicles is a fully formed bottleneck. The Lincoln Tunnel, the Mersey Tunnel, and the Mont Blanc Tunnel all exhibit this effect systematically.
- Toll plazas and checkpoints. Any point where vehicles must slow or stop reduces throughput, even if the transaction is brief. Electronic tolling reduces but does not eliminate the effect.
- Weather. Rain, fog, or snow do not close a road but reduce its effective capacity: less visibility and lower grip require greater following distances and lower speeds. The same demand on diminished capacity produces jams that would not exist on a dry day. The I-94 corridor between Chicago and Milwaukee is a well-documented example: a light snowfall that cuts speeds by 20 mph on a Tuesday morning generates gridlock that the same traffic volume on a clear day would not.
The Paradox of Road Widening: Induced Demand
Intuition says that if a road is congested, the solution is to widen it. Transport research has spent decades documenting why that intuition frequently fails: this is the concept of induced demand.
It works like this: when a road is widened, driving on it becomes faster and more comfortable, at first. That improvement attracts trips that were previously not made or were made differently: people who avoided rush hour return to it, people who used public transport switch to driving, people who used alternative routes come back, and even long-term decisions (where to live, where to work) are made assuming the new capacity. The frequent result: more lanes and a similar jam, just with more vehicles in it.
The Katy Freeway in Houston is the most cited example. Widened to 26 lanes at its broadest point after a major expansion completed in 2011, average commute times on the corridor had returned to pre-expansion levels within two years. Similar outcomes have been documented after expansions in Los Angeles, Seoul, and several German autobahn corridors. The same logic applies to urban arterials in London and Paris, where adding lane capacity at key junctions has repeatedly been followed by rising vehicle volumes that eroded the initial gains.
This does not mean widening never works (there are specific bottlenecks where it does) but it explains why no major city in the world has eliminated congestion through asphalt alone, and why modern traffic management invests as much in spreading demand as in increasing supply.
How to Avoid Traffic Jams Using Real-Time Data
Now for the practical part: how to avoid traffic jams using the information that is available to anyone today.
First rule: check congestion before you leave, not once you are already in it. The valuable decision (delaying departure by twenty minutes, changing route entirely, or even switching to a different mode of transport) is only possible before you start moving. Once in the queue, your options narrow to enduring it. If you want to understand where that red colour on the map comes from, how traffic is measured using inductive loops, cameras, and floating vehicle data is worth reading first.
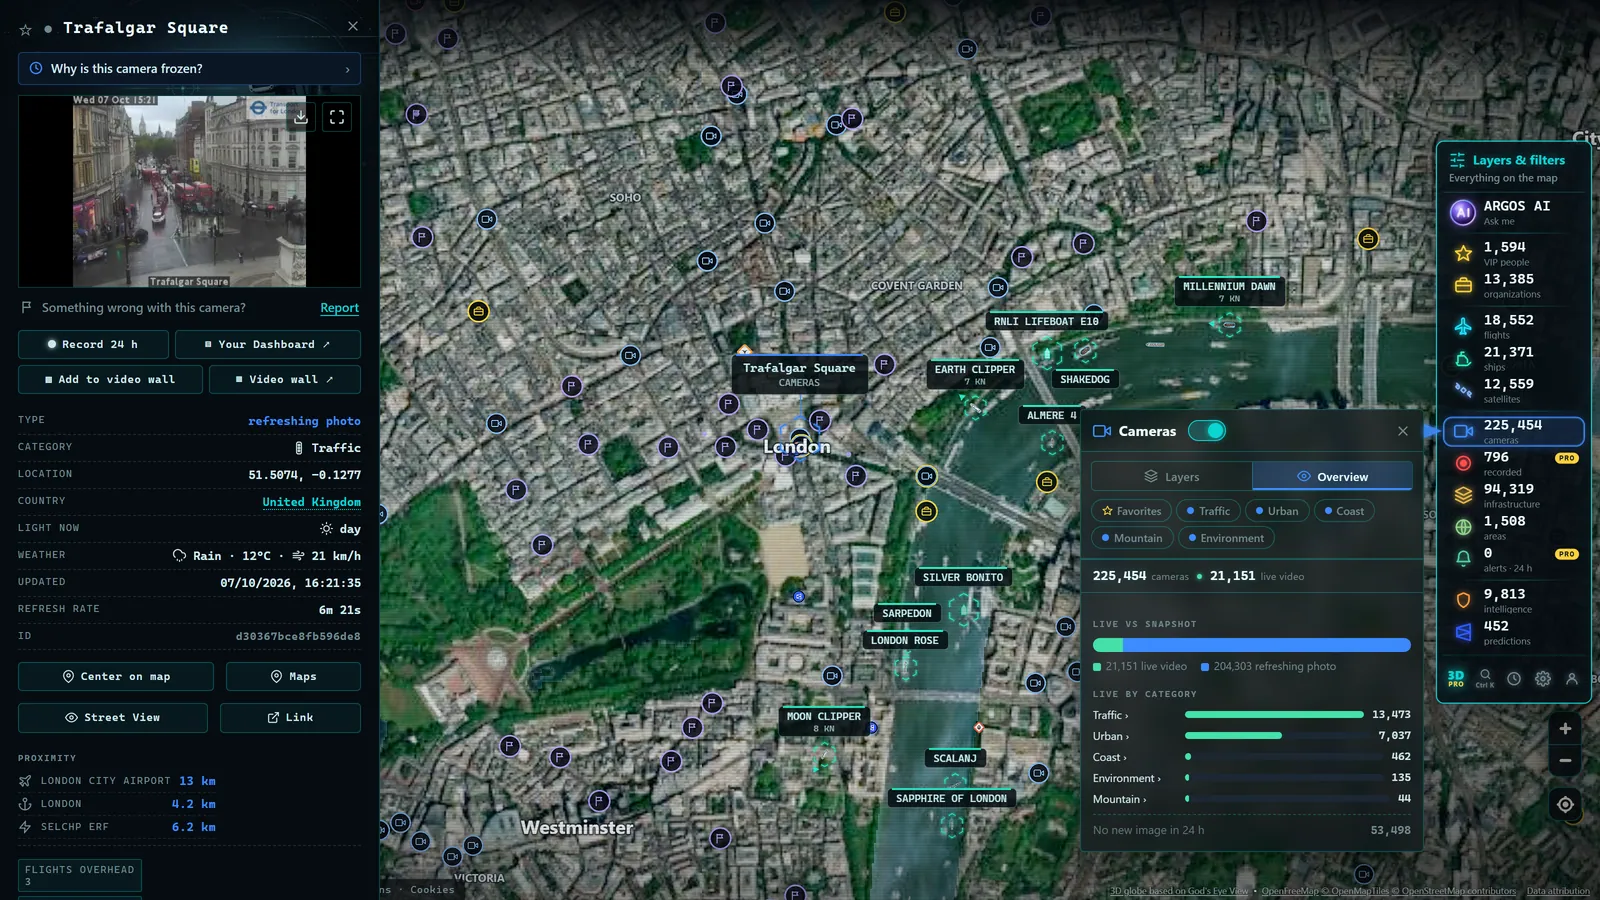
Second rule: confirm with cameras what the app only estimates. The colour on the map is a statistical inference; the image from a public traffic camera is reality. Seeing the section tells you whether the queue is a solid wall of stationary vehicles or dense but moving traffic, whether a lane is closed, or whether the incident is already dissolving. That visual verification is the perfect complement to the data point, and it is what Argos Atlas makes straightforward through its live camera layer.
Third rule: exploit off-peak windows. Peaks are narrow: shifting your departure by thirty minutes can transform the journey. Anyone with schedule flexibility has, in practice, a significant advantage against congestion.
Fourth rule: evaluate alternative routes honestly. An alternative only pays off if its capacity can absorb your arrival along with everyone else who had the same idea; diverting highway traffic onto narrow urban streets usually ends badly for everyone. Evaluate the alternative for what it is, not just for the colour it shows right now.
What Data Cannot Solve
It is worth being honest about the limits. Real-time data optimises your individual decision but does not create capacity: if everyone avoids the jam via the same alternative, the jam simply moves there. When the entire network is saturated (the morning of a severe storm, the evening of a holiday getaway) there is no good route, only less bad ones. Information distributes demand better and shaves off the worst peaks, but structural congestion is addressed through collective decisions that go beyond any app: public transport, staggered working hours, urban planning. Knowing this saves frustration and helps you use data for what it actually delivers.
Frequently Asked Questions
What is a phantom traffic jam?
A queue with no visible cause. It originates from a single braking event that, in dense traffic, amplifies from vehicle to vehicle and propagates backward like a wave, capable of surviving for miles and minutes after the original cause has disappeared. The classic closed-loop driving experiment shows that, with sufficient density, these waves arise spontaneously from small human variations, without any external incident.
What are the worst times to drive?
The rush hours of weekdays, linked to the start and end of the workday and school runs, in the morning and late afternoon. Mondays and Fridays distort those peaks with their own patterns, and holiday getaway periods generate the most intense episodes of the year on the main exit corridors from large cities. The exact pattern for each road becomes clear quickly by checking real-time data over a few days.
Do more lanes mean fewer traffic jams?
It is not guaranteed, and over the medium term it often does not happen. Induced demand, well documented in transport research, describes how new capacity attracts new trips: drivers who shift their time, their route, or their mode of transport until congestion reappears. Widening can resolve specific bottlenecks, but it has not eliminated congestion in any major city.
Do traffic apps really help avoid jams?
Yes, within their limits. Deciding on time and route with real information saves time tangibly compared to driving blind, and confirming with cameras what the map estimates adds a layer of certainty. What apps cannot do is create capacity: with the network saturated there is no good route, and popular alternatives become saturated in turn. They are a strong individual tool, not a collective solution.
Conclusion
Traffic jams are not an arbitrary punishment: they are the physics of flow near its limit, waves travelling backward, demand arriving in waves, and geometries that strangle capacity. Understanding this changes how you drive (more following distance, fewer hard braking events, more patience with the phantom) and above all how you plan: checking before you leave, verifying with live images, and exploiting off-peak windows is worth more than any improvised shortcut. To put the verification part into practice, open the map and take a look at the public traffic cameras on your route before you pull out of the driveway.
Frequently asked questions
What is a phantom traffic jam?
A traffic jam that appears with no visible cause, no accident, no roadworks, nothing. It originates from a single braking event that, in dense traffic, propagates backward like a wave, amplifying from vehicle to vehicle. By the time you reach the point where it started, the original cause is long gone; only the queue remains.
What are the worst times to drive?
On weekdays, the morning and evening rush hours linked to the start and end of the workday and school runs. Mondays and Fridays have their own distinct patterns, and holiday getaway periods concentrate extraordinary peaks on the main corridors out of large cities. Each road has its own specific pattern, which real-time data reveals quickly.
Do more lanes mean fewer traffic jams?
Not necessarily, and over the medium term often not. Transport research describes induced demand: when a road is widened and improved, it attracts trips that were previously not made or were made via other routes and times, and congestion tends to reappear. Widening helps in some cases, but it is not a guaranteed cure.
Do traffic apps really help avoid jams?
Yes, with caveats. They let you choose your departure time and route with real information rather than blindly, and that saves time in a tangible way. But they do not perform miracles: if the entire network is saturated there is no good route, and if many drivers follow the same alternative, the jam simply moves somewhere else.